Laboratory for Satellite Altimetry / Sea Ice and Polar Dynamics Science Team
Sea Ice Surface Roughness
Sea ice surface roughness, σelev, is defined as the standard deviation of elevation per unit area. σelev is derived from Airborne Topographic Mapper (ATM) lidar elevation data acquired during the late winter months of March, April, and May during NASA's annual Operation IceBridge (OIB) airborne campaigns in the Arctic.
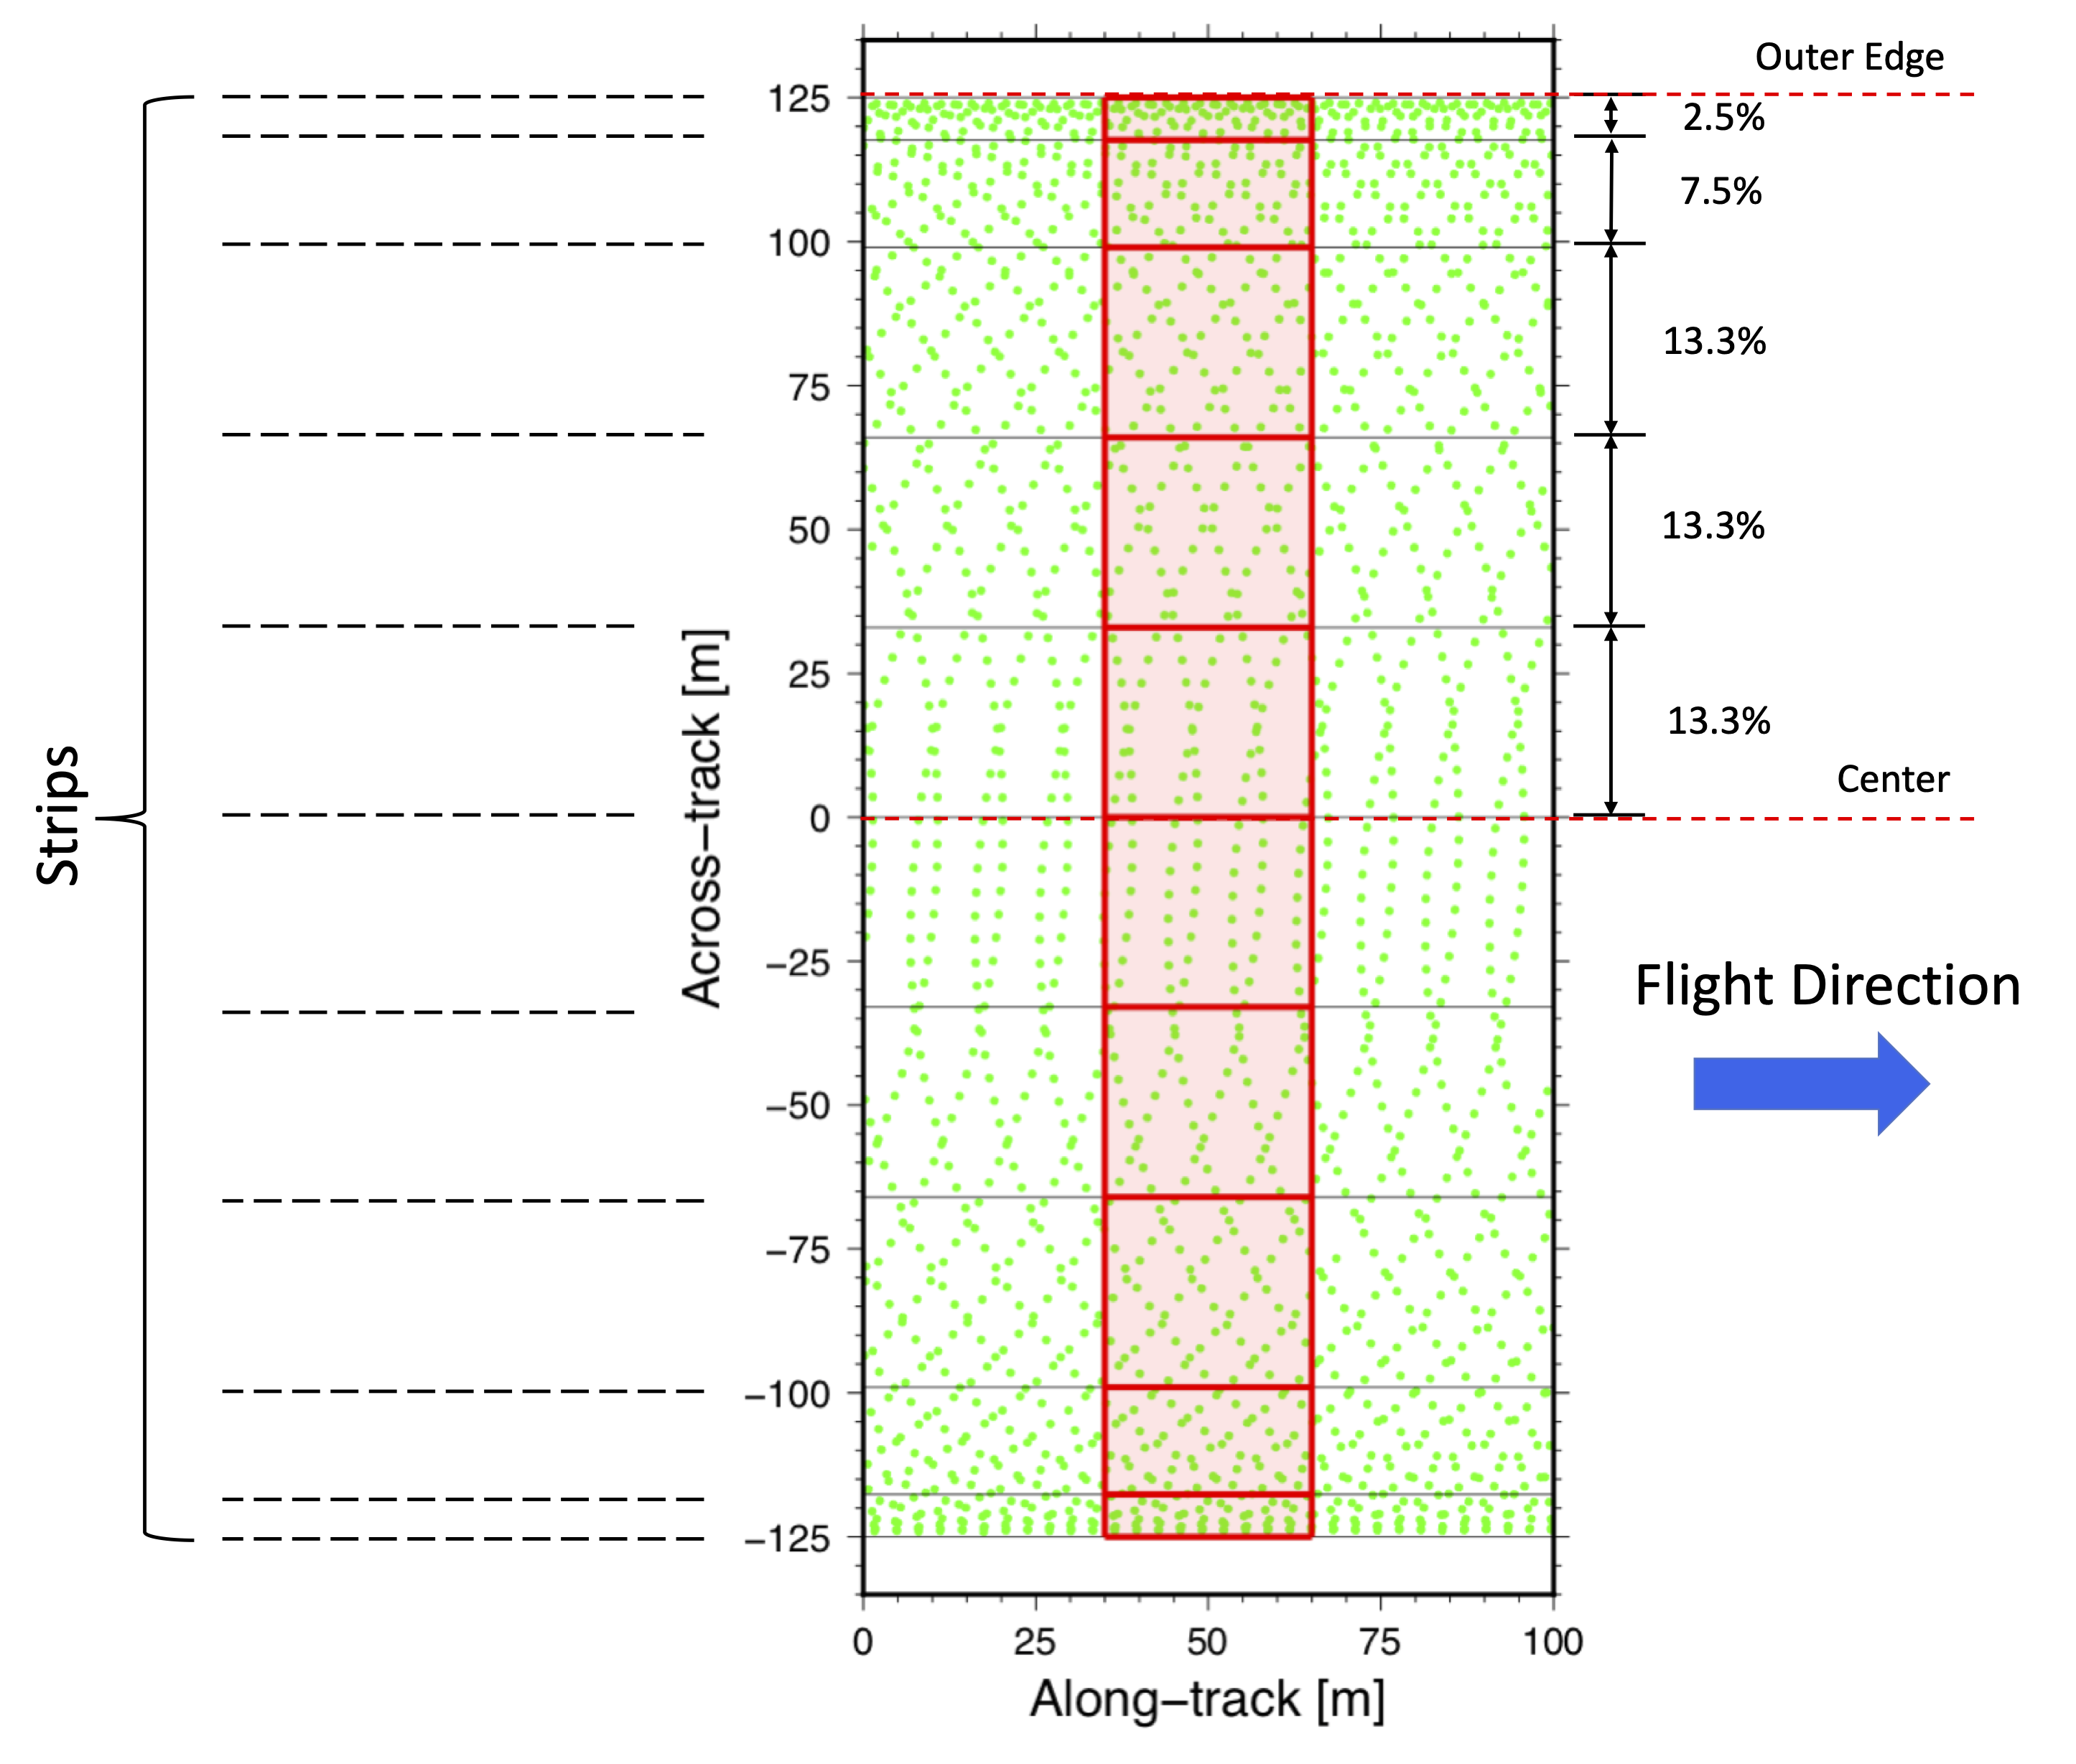
Due to the conical scanning geometry of the ATM lidar (Krabill, 2002), across-track sampling (green dots, Figure 1) is non-uniform, with sampling density greatest at the swath edges. To account for the variation in sample density, ATM elevation data are gridded. Each grid cell (red boxes, Figure 1) has an along-track dimension of 30 m and an across-track dimension that is inversely proportional to the across-track sampling density. For example, at a nominal flight altitude of 500 m, cells at the swath edges are ~ 6 m wide in the across-track direction, while cells at the center of the swath are ~ 34 m wide in the across-track direction. The grid configuration optimizes ATM sample density providing high-resolution measurements of sea ice surface roughness while still containing enough point measurements for robust statistical calculations.

Figure 1. Depiction of gridding configuration applied to ATM lidar elevation data in the derivation of sea ice surface roughness, σelev.
Data Product and Data Access
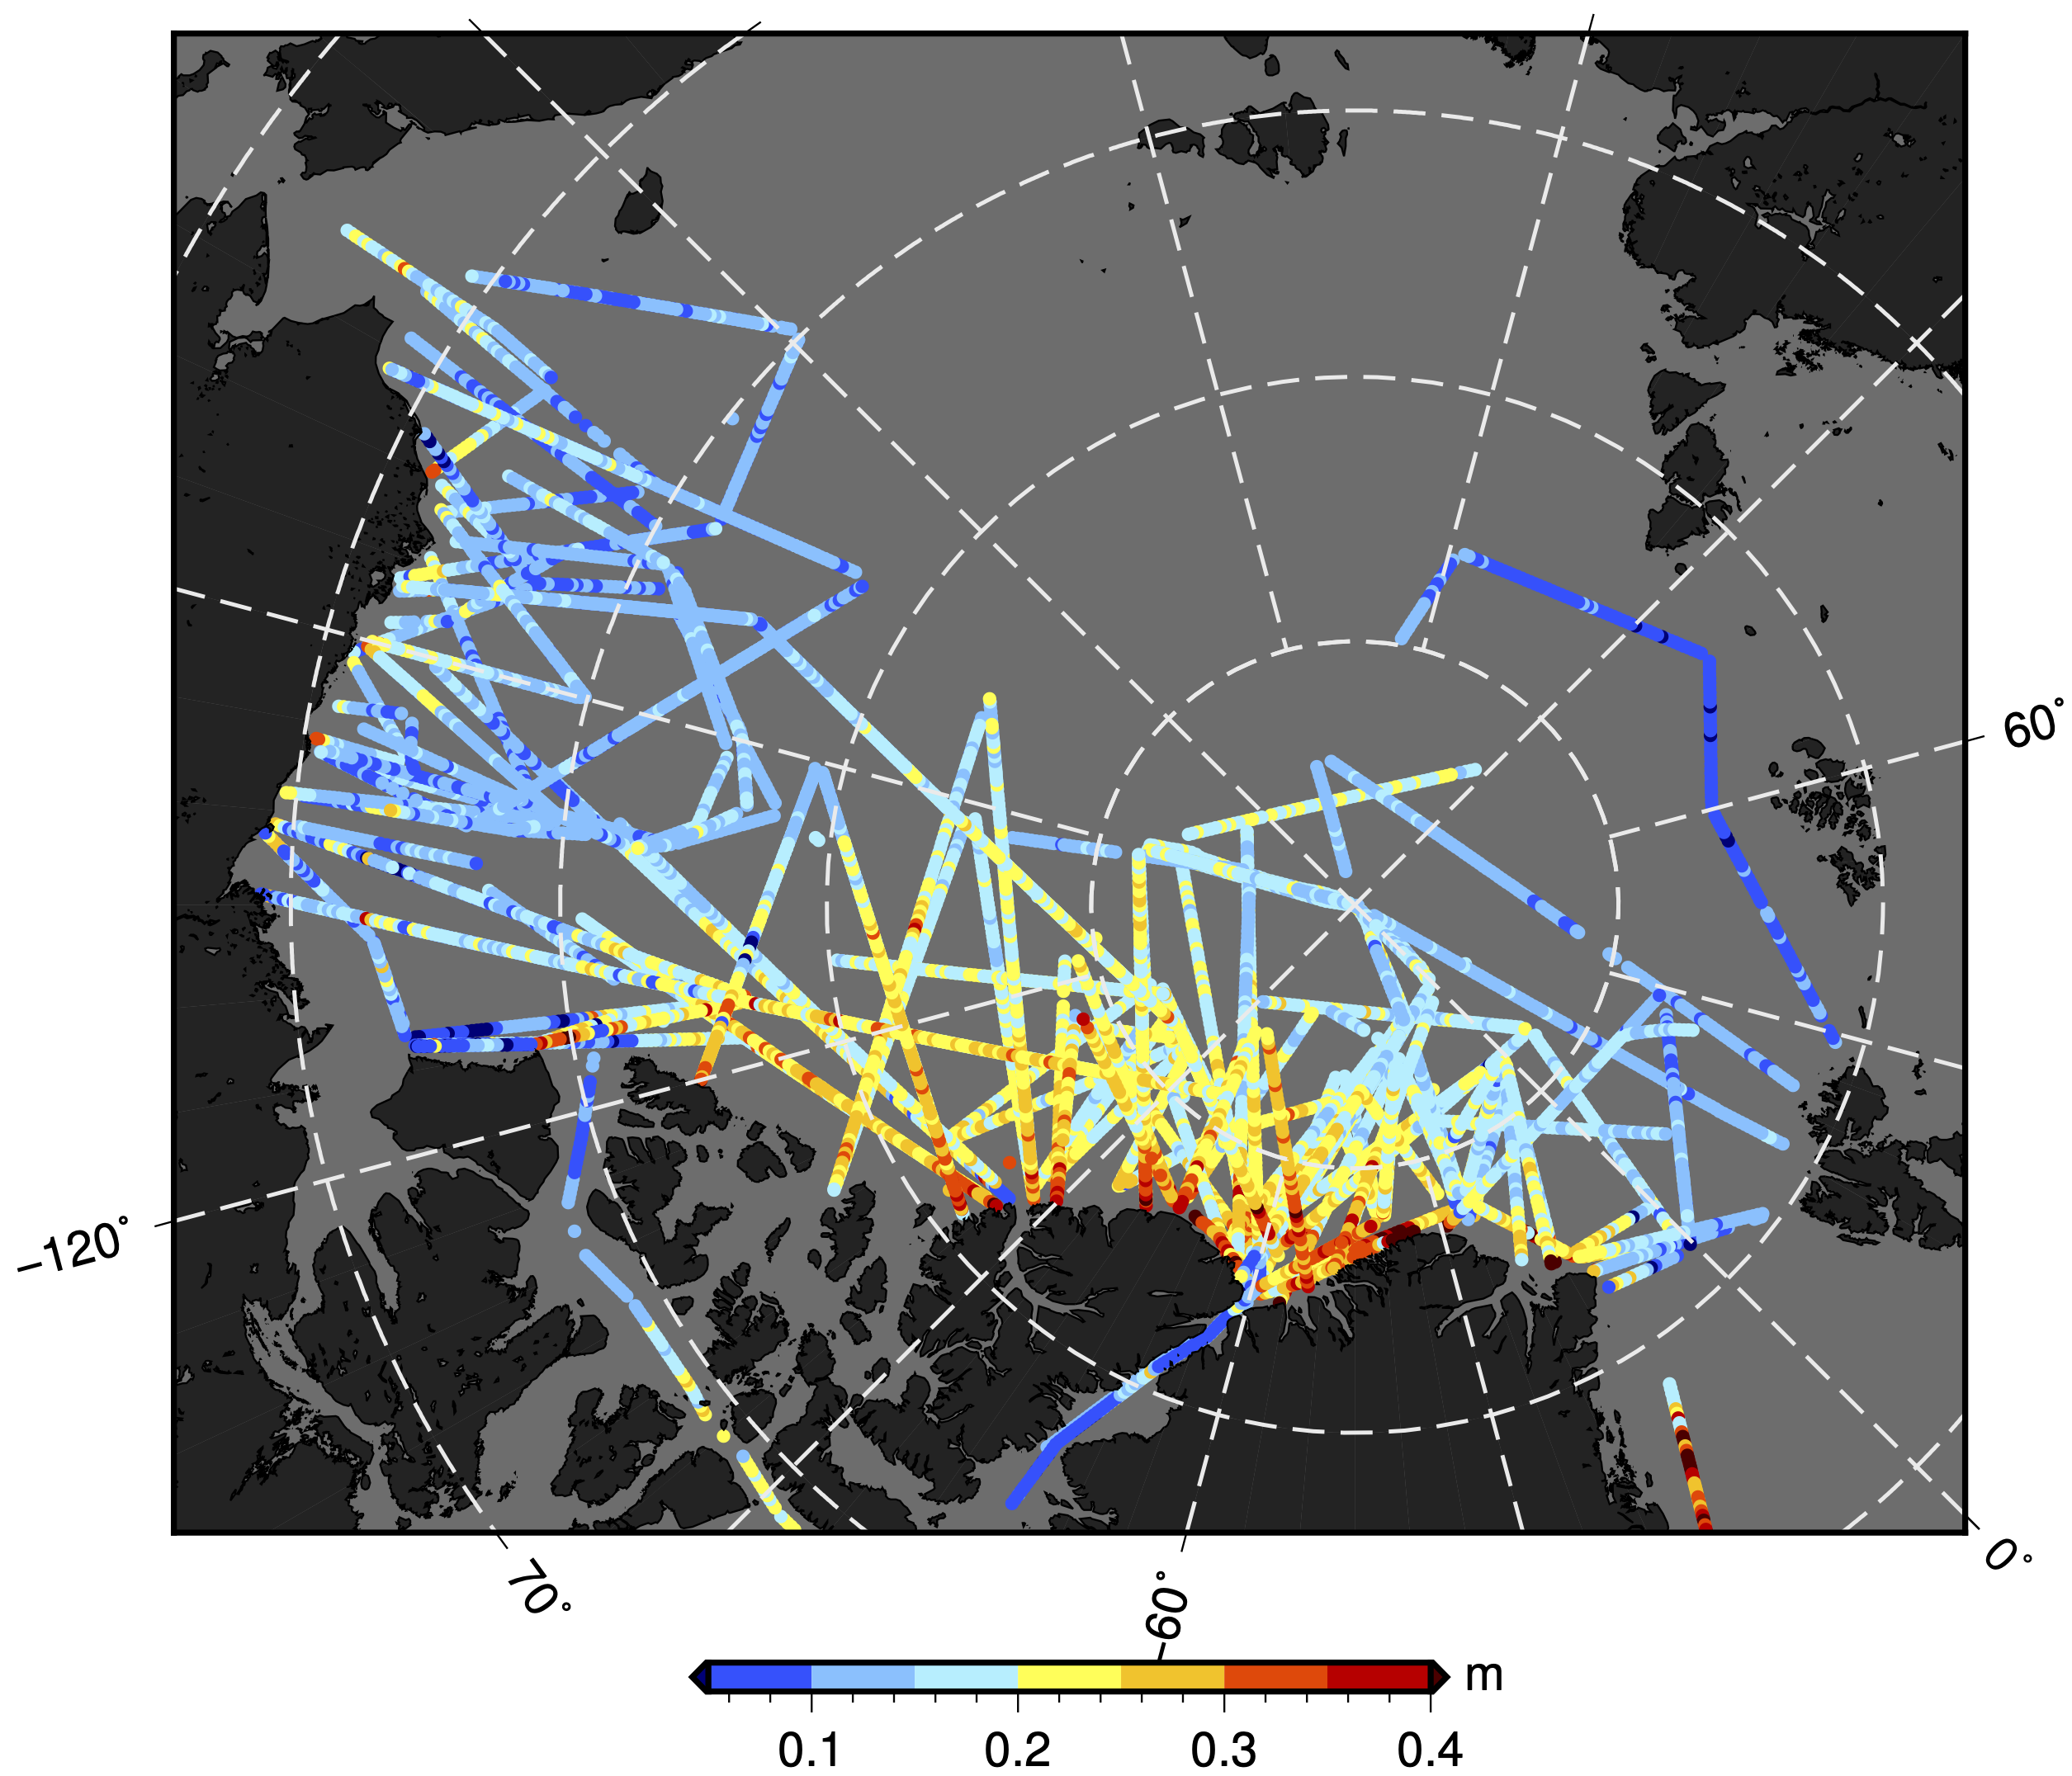
The NOAA / NESDIS / STAR / Laboratory for Satellite Altimetry (LSA) Polar Ocean Data System (PODS) Arctic Sea Ice Surface Roughness is derived from ATM lidar elevation measurements acquired during annual, low-altitude NASA OIB airborne surveys over Arctic sea ice. ATM measurements were acquired between March and May, 2009–2019. σelev is derived per grid cell (Figure 1). Statistics are computed on the distribution of σelev for 10 km along-track segments, for each aircraft flight line (Figure 2).

Figure 2. Mean sea ice surface roughness, σelev, for 10 km along-track segments for OIB Arctic flights between March and May, 2009-2018.
Acknowledgment:Users are free to use the information hosted on this site in their research, provided credit is given to the NOAA / NESDIS Center for Satellite Applications and Research (STAR) Laboratory for Satellite Altimetry (LSA). Users are also asked to cite the following publication whenever these data are used: Connor, L., S. Farrell and D. McAdoo (2017), A decadal study of interannual variability in Arctic sea ice freeboard using airborne laser altimetry (2006-2016), presented at the 2017 IGS International Symposium on Polar Ice, Polar Climate, and Polar Change, Boulder, Colorado, 14-19 Aug. 2017. https://www.igsoc.org/symposia/2017/boulder/proceedings/procsfiles/procabstracts_71.html#A2583
Data access:
- https://www.star.nesdis.noaa.gov/data/socd3/lsa/SeaIceProducts/Airborne/IceBridge/SurfaceRoughness/
- NCEI Archive
- NOAA PolarWatch
Point of Contact: Laurence.Connor@noaa.gov
End Users
The surface roughness data product can be used to improve the characterization of sea ice dynamics in high-resolution sea ice models. It also provides a basis for calibration and validation for sea ice surface roughness measurements derived from other satellite missions such as ASCAT, ICESat-2 and Sentinel-3. End users of this sea ice data product include modelers and academia conducting basic research.
