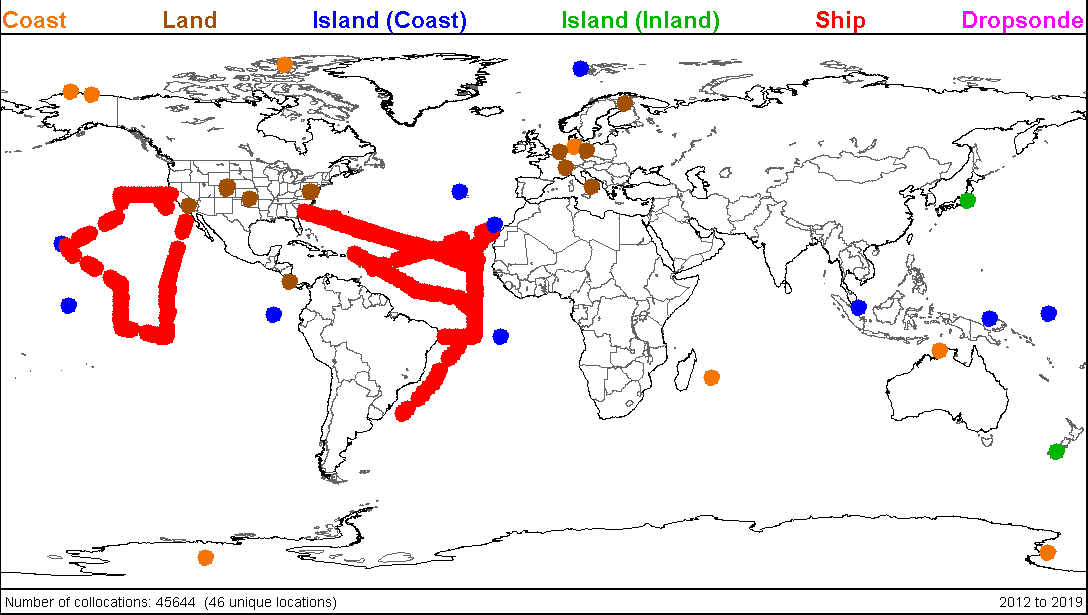
NPROVS Special Summary Plots
Special observations refer to the ground truth radiosondes used for assessment, namely the Global Climate Observing System (GCOS) Reference Upper Air Network (GRUAN) and NOAA funded satellite synchronized ground truth radiosondes available at the original high vertical density.
| Station | Station ID | Data Record | Instrument Types | GRUAN |
|---|---|---|---|---|
| Ascension Island | ASCENS | 29 Apr 2017 - Present | RS92 | |
| AEROSE 2013 | WTEC | 9 Jan 2013 - 7 Dec 2013 | RS92 | X |
| AEROSE 2015 | WTEC | 13 Feb 2015 -17 Nov 2015 | RS92 | |
| AEROSE 2017 | WTEC | 13 Feb 2017 - 7 Mar 2017 | RS41/RS92 | |
| McMurdo Station, Antarctica | 89664 | 30 Nov 2015 - 3 Jan 2017 | RS92 | |
| Western Antarctic Ice Sheet | WAIS | 4 Dec 2015 - 18 Jan 2016 | RS92 | |
| Barrow, North Slope Alaska | 70027 | 01 Jan 2011 - Present | RS41/RS92 | X |
| Howard University Beltsville, Maryland | BELTSV | 07 Mar 2012 - Present | RS92/RS41 | X |
| Hamburg, Germany | 10141 | 09 Jun 2016 - 06 Jan 2017 | RS41 | |
| Boulder, Colorado | BOULDE | 24 Aug 2011 - 31 Aug 2016 | RS92/RS41 | X |
| Cabauw, Netherlands | 06260 | 01 Jan 2011 - 16 Jan 2017 | RS92/RS41 | X |
| CalWater Campaign | ACAPEX | 12 Jan 2015 - 10 Feb 2015 | RS92 | |
| CIRA Colorado State University | CIRA | 6 May 2016 - 22 Sep 2016 | RS41/RS92 | |
| ENNR Campaign | WTEC | 16 Feb 2016 - 16 Mar 2016 | RS92 | |
| Christmas Island, ENRR | CXENRR | 26 Jan 2016 - 13 Mar 2016 | RS92 | |
| Darwin, Australia | 94120 | 01 Apr 2014 - 14 Jan 2015 | RS92 | |
| Eastern North Atlantic, Azores, Portugal | GRACIO | 28 Sep 2013 - Present | RS92/RS41 | X |
| Eureka, Canada | 71917 | 24 Oct 2012 - 18 Mar 2013 | RS92 | X |
| Gan, Maldives Islands | 43599 | 22 Sep 2011 - 09 Feb 2012 | RS92 | X |
| Lauder, New Zealand | LAUDER | 11 Dec 2012 - Present | RS41/RS92 | X |
| Lindenberg, Germany | 10393 | 01 Jan 2011- Present | RS92/RS41 | X |
| Manus, Papua New Guinea | 92036 | 01 Jul 2013 - 06 Jul 2014 | RS92 | X |
| Nauru Island | 91532 | 01 Jan 2011 - 26 Aug 2013 | RS92 | X |
| Ny Alesund, Svalbard, Norway | 01004 | 19 Oct 2012 - Present | RS92/RS92 | X |
| Oliktok Point, Alaska | OLIKTO | 10 Sept 2013 - Present | RS92 | |
| Ougadougou, Burkina Faso | 65503 | 17 Jul 2012 - 01 Aug 2012 | RS92 | X |
| Payerne, Switzerland | 06610 | 23 Sep 2011 - 19 Dec 2016 | RS92/RS41 | X |
| Potenza, Italy | 16300 | 23 Feb 2011 - 05 May 2016 | RS92/RS41 | X |
| Reunion (La Reunion Island), France | REUNIO | 08 April 2013 - Present | RS92/RS41 | X |
| San Cristobol, Galapagos, Ecuador | 84008 | 03 Aug 2012 - 26 Jan 2015 | RS92 | X |
| San Jose, Costa Rica | 78762 | 04/10/2012 - 02/21/2014 | RS92 | X |
| Singapore, Singapore | 48698 | 13 April 2016 - Present | RS41 | X |
| Southern Great Plains, Oklahoma | 74646 | 01 Jan 2011 - Present | RS92/RS41 | X |
| Sodankyla, Finland | 02836 | 05 Jan 2011 - 24 March 2017 | RS92/RS41 | X |
| Neumayer, Antarctica (DE) | 89002 | 18 Feb 2020 - Present | RS41 | |
| Tateno, Japan | 47646 | 06 June 2011 - Present | RS92/RS41 | X |
| Tenerife, Spain | 60018 | 01 Oct 2014 - 12 Dec 2017 | RS92/RS41 | X |
| Table Mountain Facility, California | TMFJPL | 22 Jul 2011 - 01 Jul 2016 | RS92/RS41 | X |
Summary Performance Trends
Summary performance trend plots show SAT-minus-RAOB RMS statistics for Temperature and Water Vapor Fraction (%) for "coarse" pressure layers (effective pressure) for respective product suites (i.e., NUCAPS, MiRS, etc). Plots are segregated for each Station ID and IR+MW and MW-only sounding types, respectively. Plots represent independent (optimal) samples of respectively QC'd soundings from the following satellite combinations (and NWP):
- NUCAPS and MetOp
- NOAA, GOES, and EOS
- GPSRO and NWP
Since July 2013, performance trends are updated monthly and produced for Long term (monthly averages)

