NOAA Center for Satellite Applications and Research banner
 
National Oceanic & Atmospheric Administration website NOAA Center for Satellite Applications and Research website

STAR / SMCD / VIIRS Aerosol Calibration and Validation

VIIRS Aerosol Product Evaluation with AErosol RObotic NETwork (AERONET) data

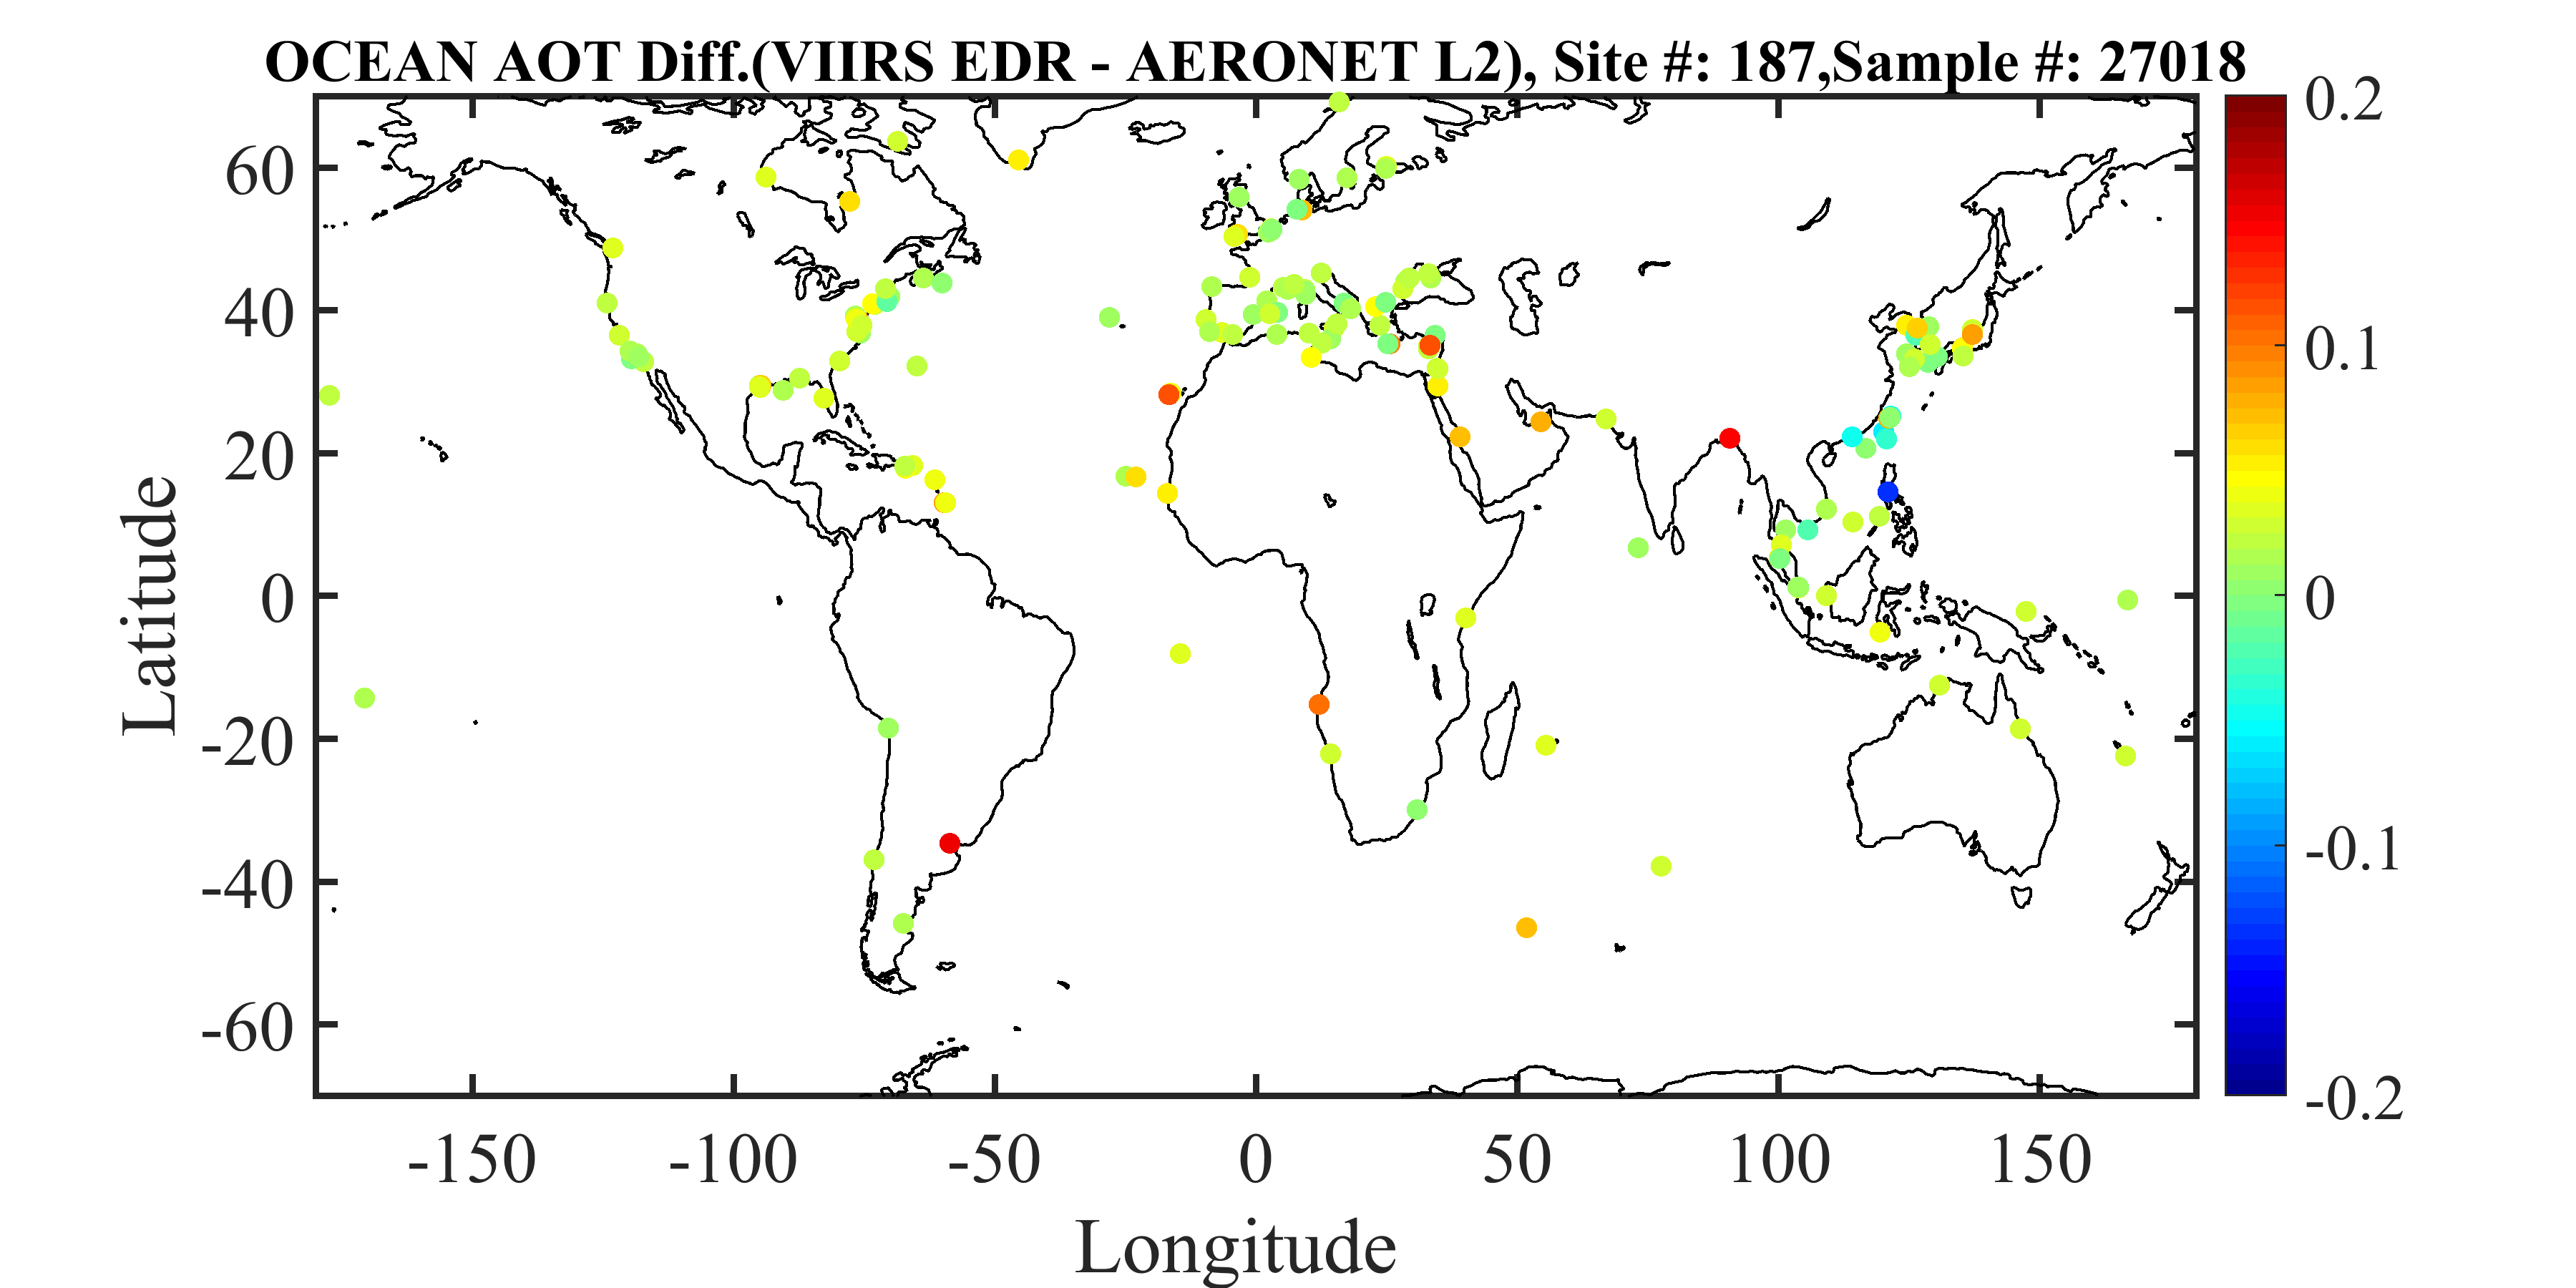
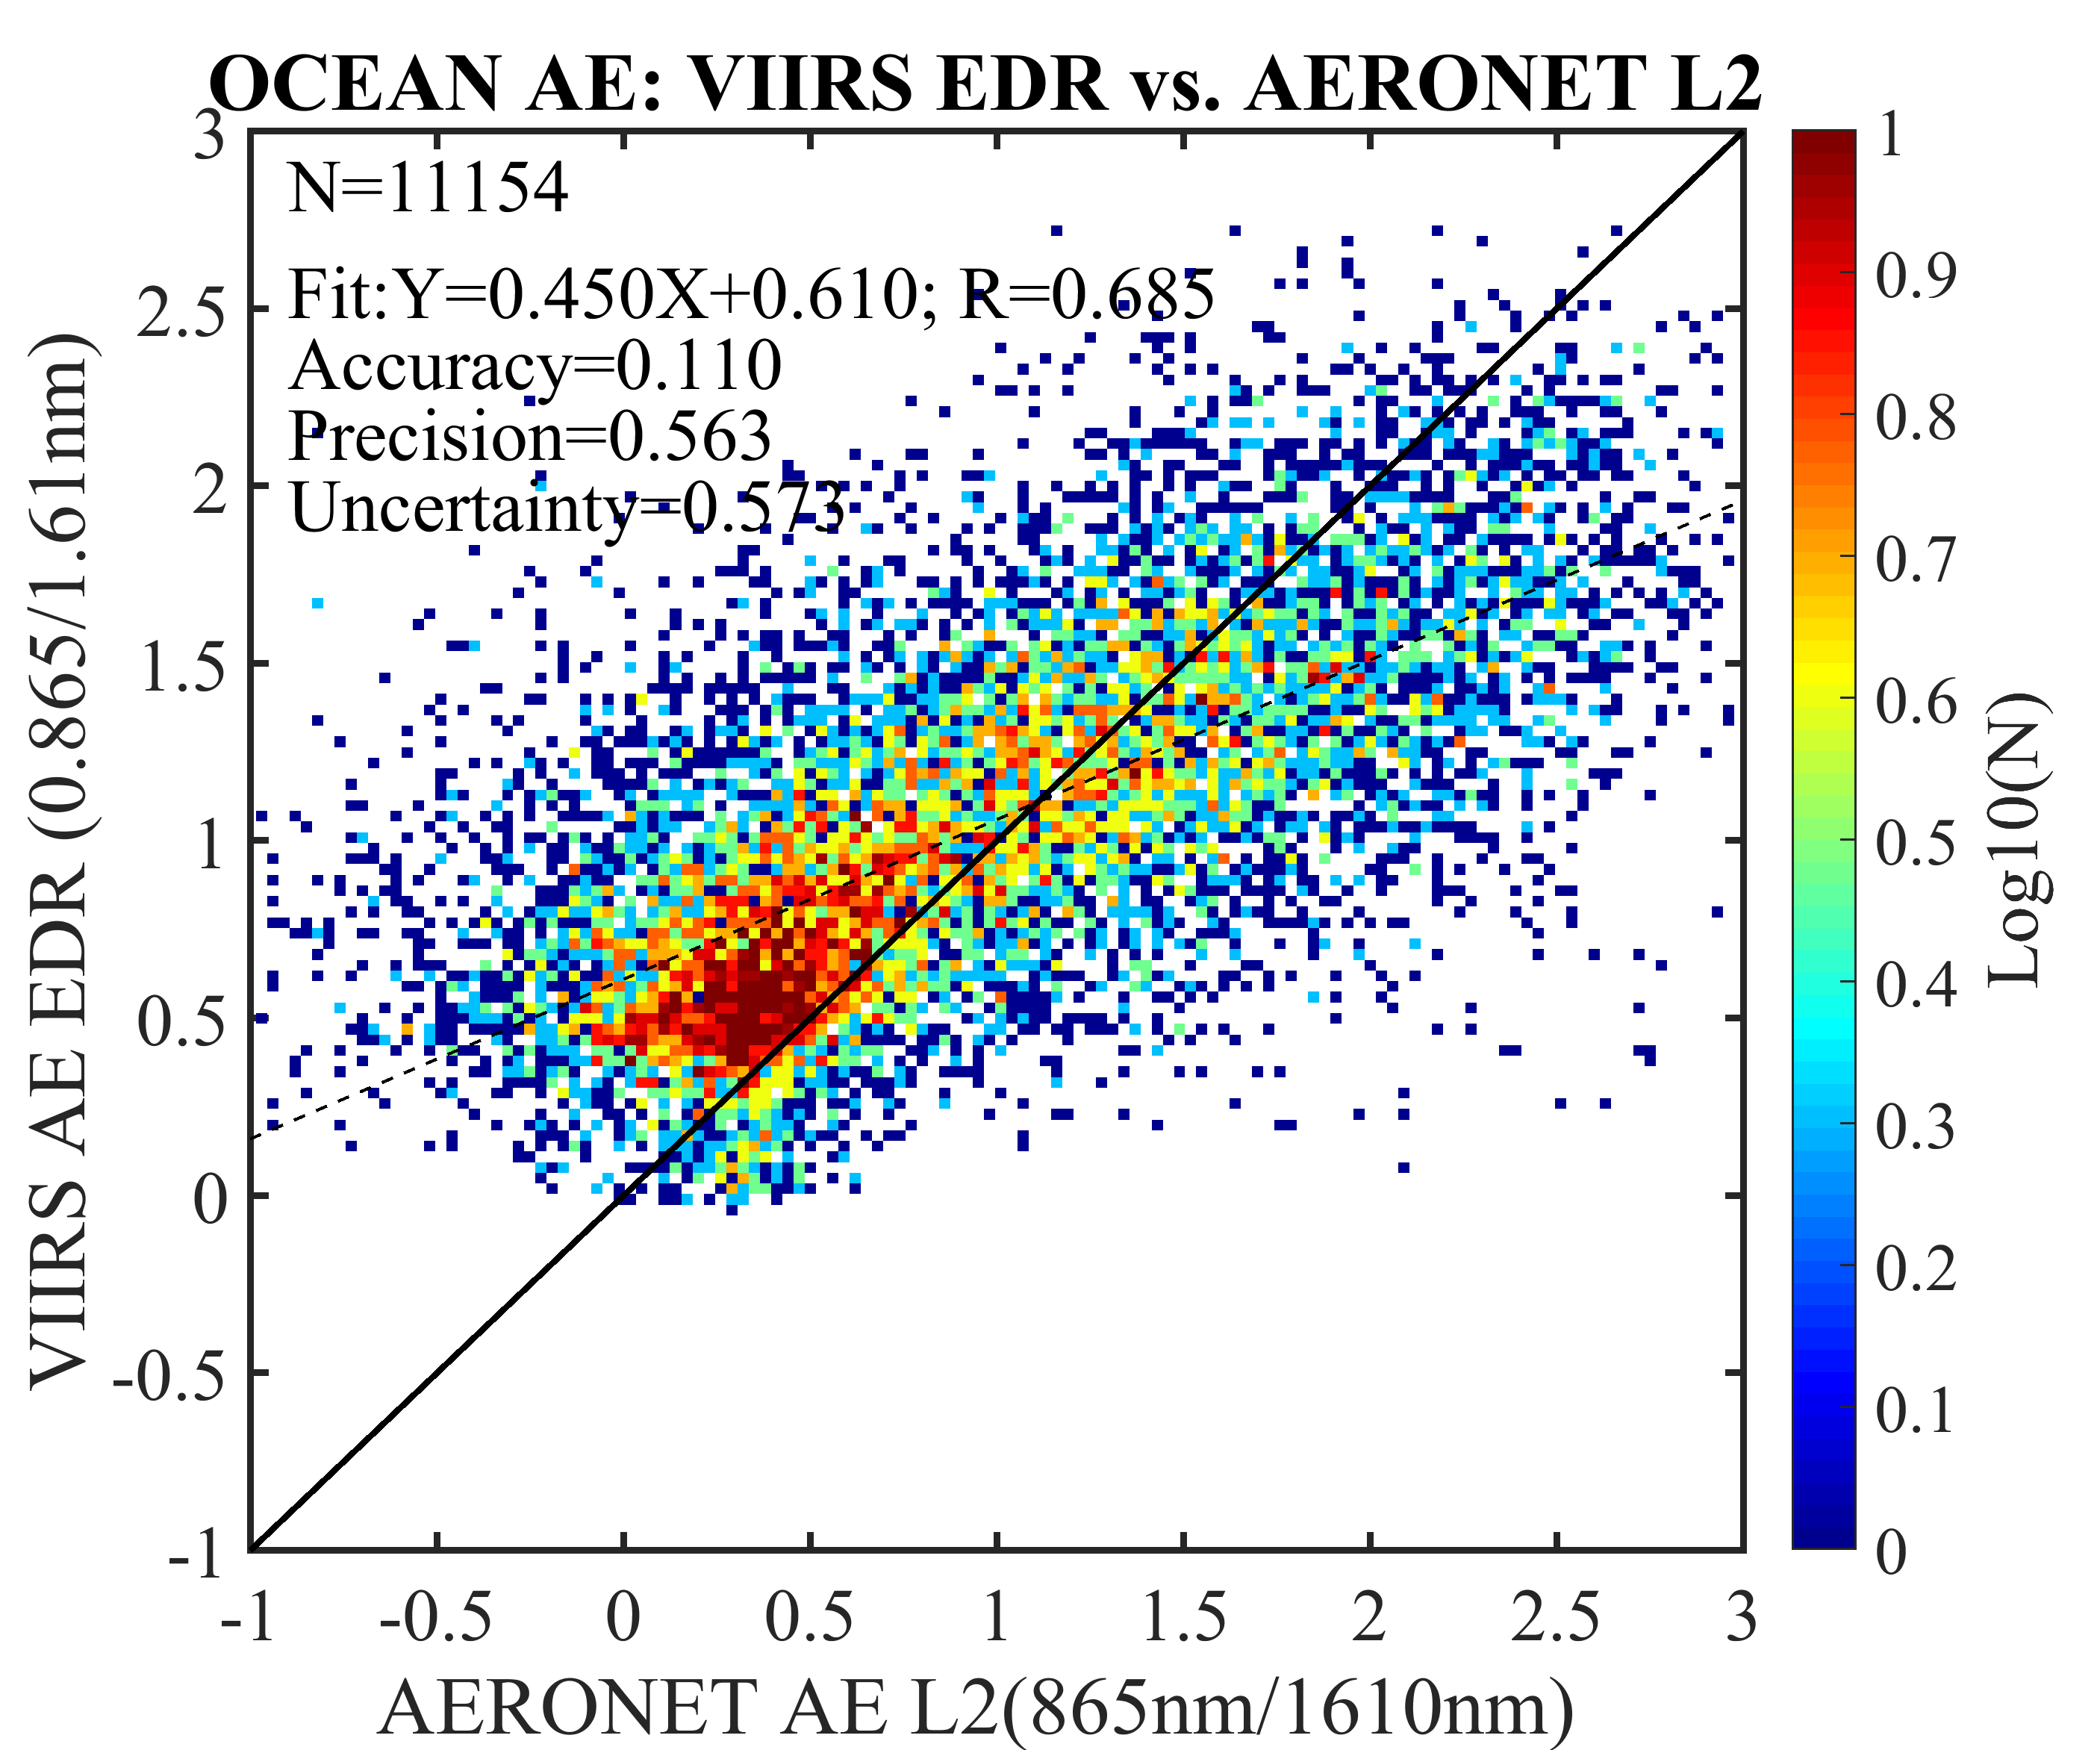
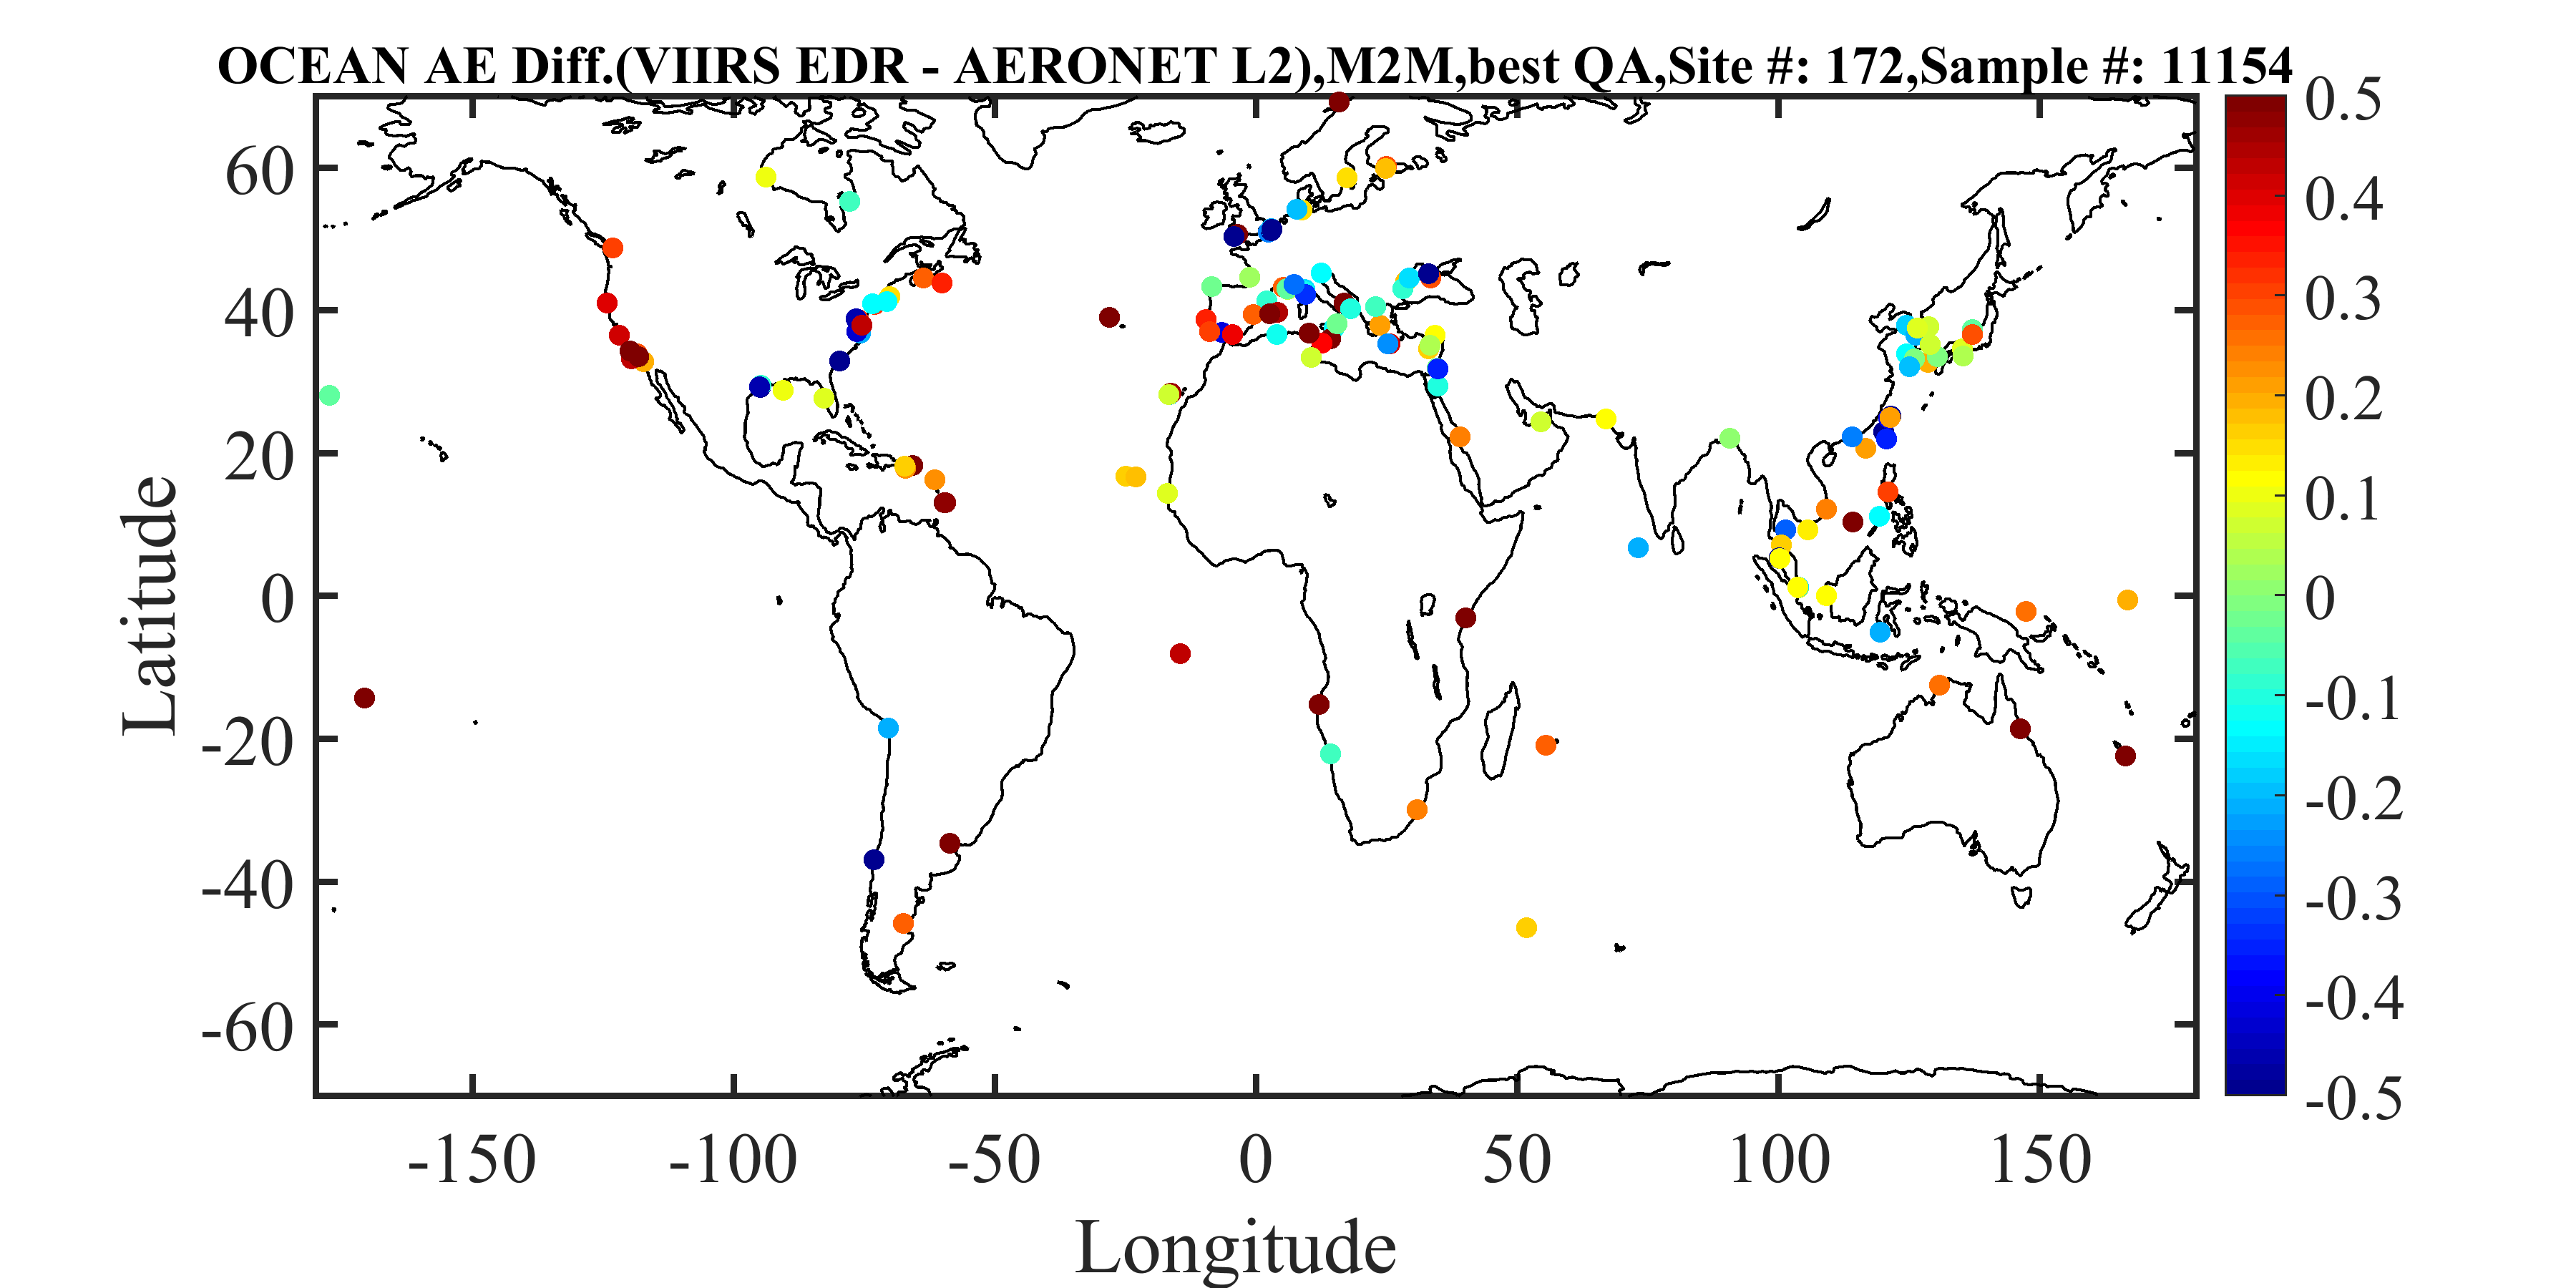
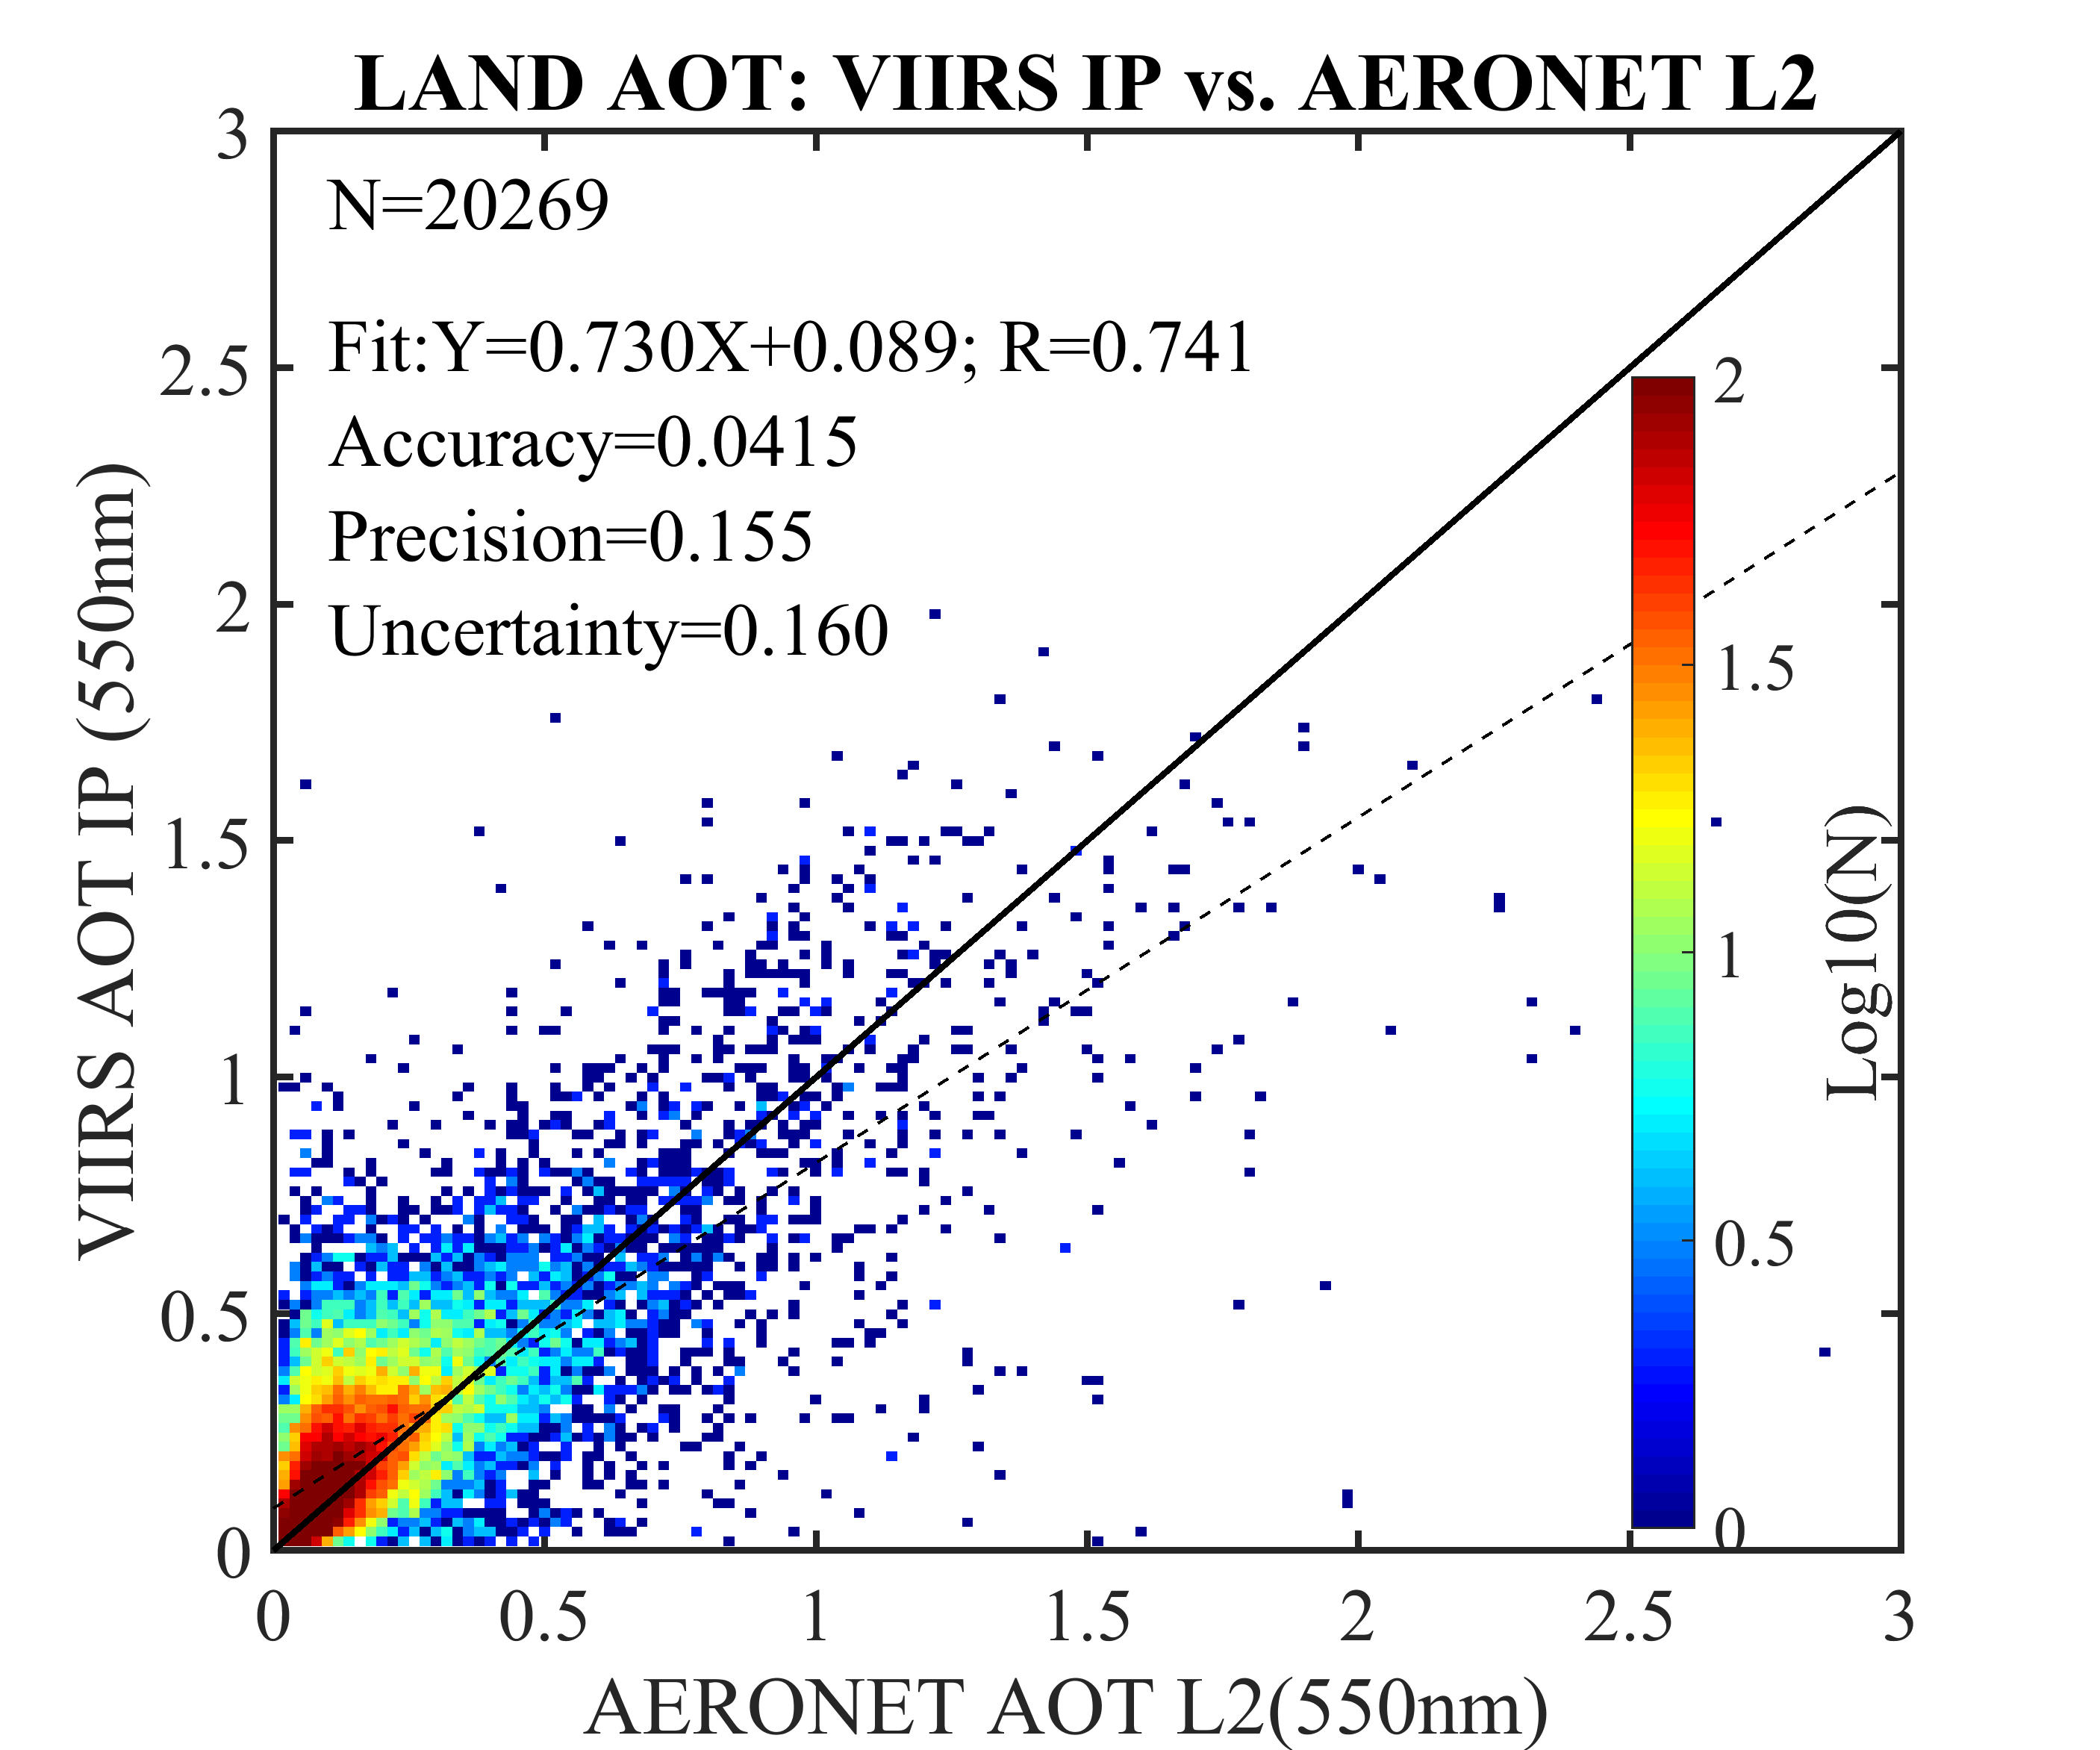
For product validation purposes, the VIIRS aerosol products, namely Aerosol Optical Thickness (AOT) and Angstrom Exponent (AE), were compared to the spatiotemporally matched Aerosol Robotic Network (AERONET) measurements.

The match-up and quality control criteria follows the Multi-sensor Aerosol Products Sampling System (MAPSS) protocol (Petrenko et al.,2012):

  • AERONET L2.0 Direct Sun measurements are averaged within ±30 minutes of VIIRS overpass time.
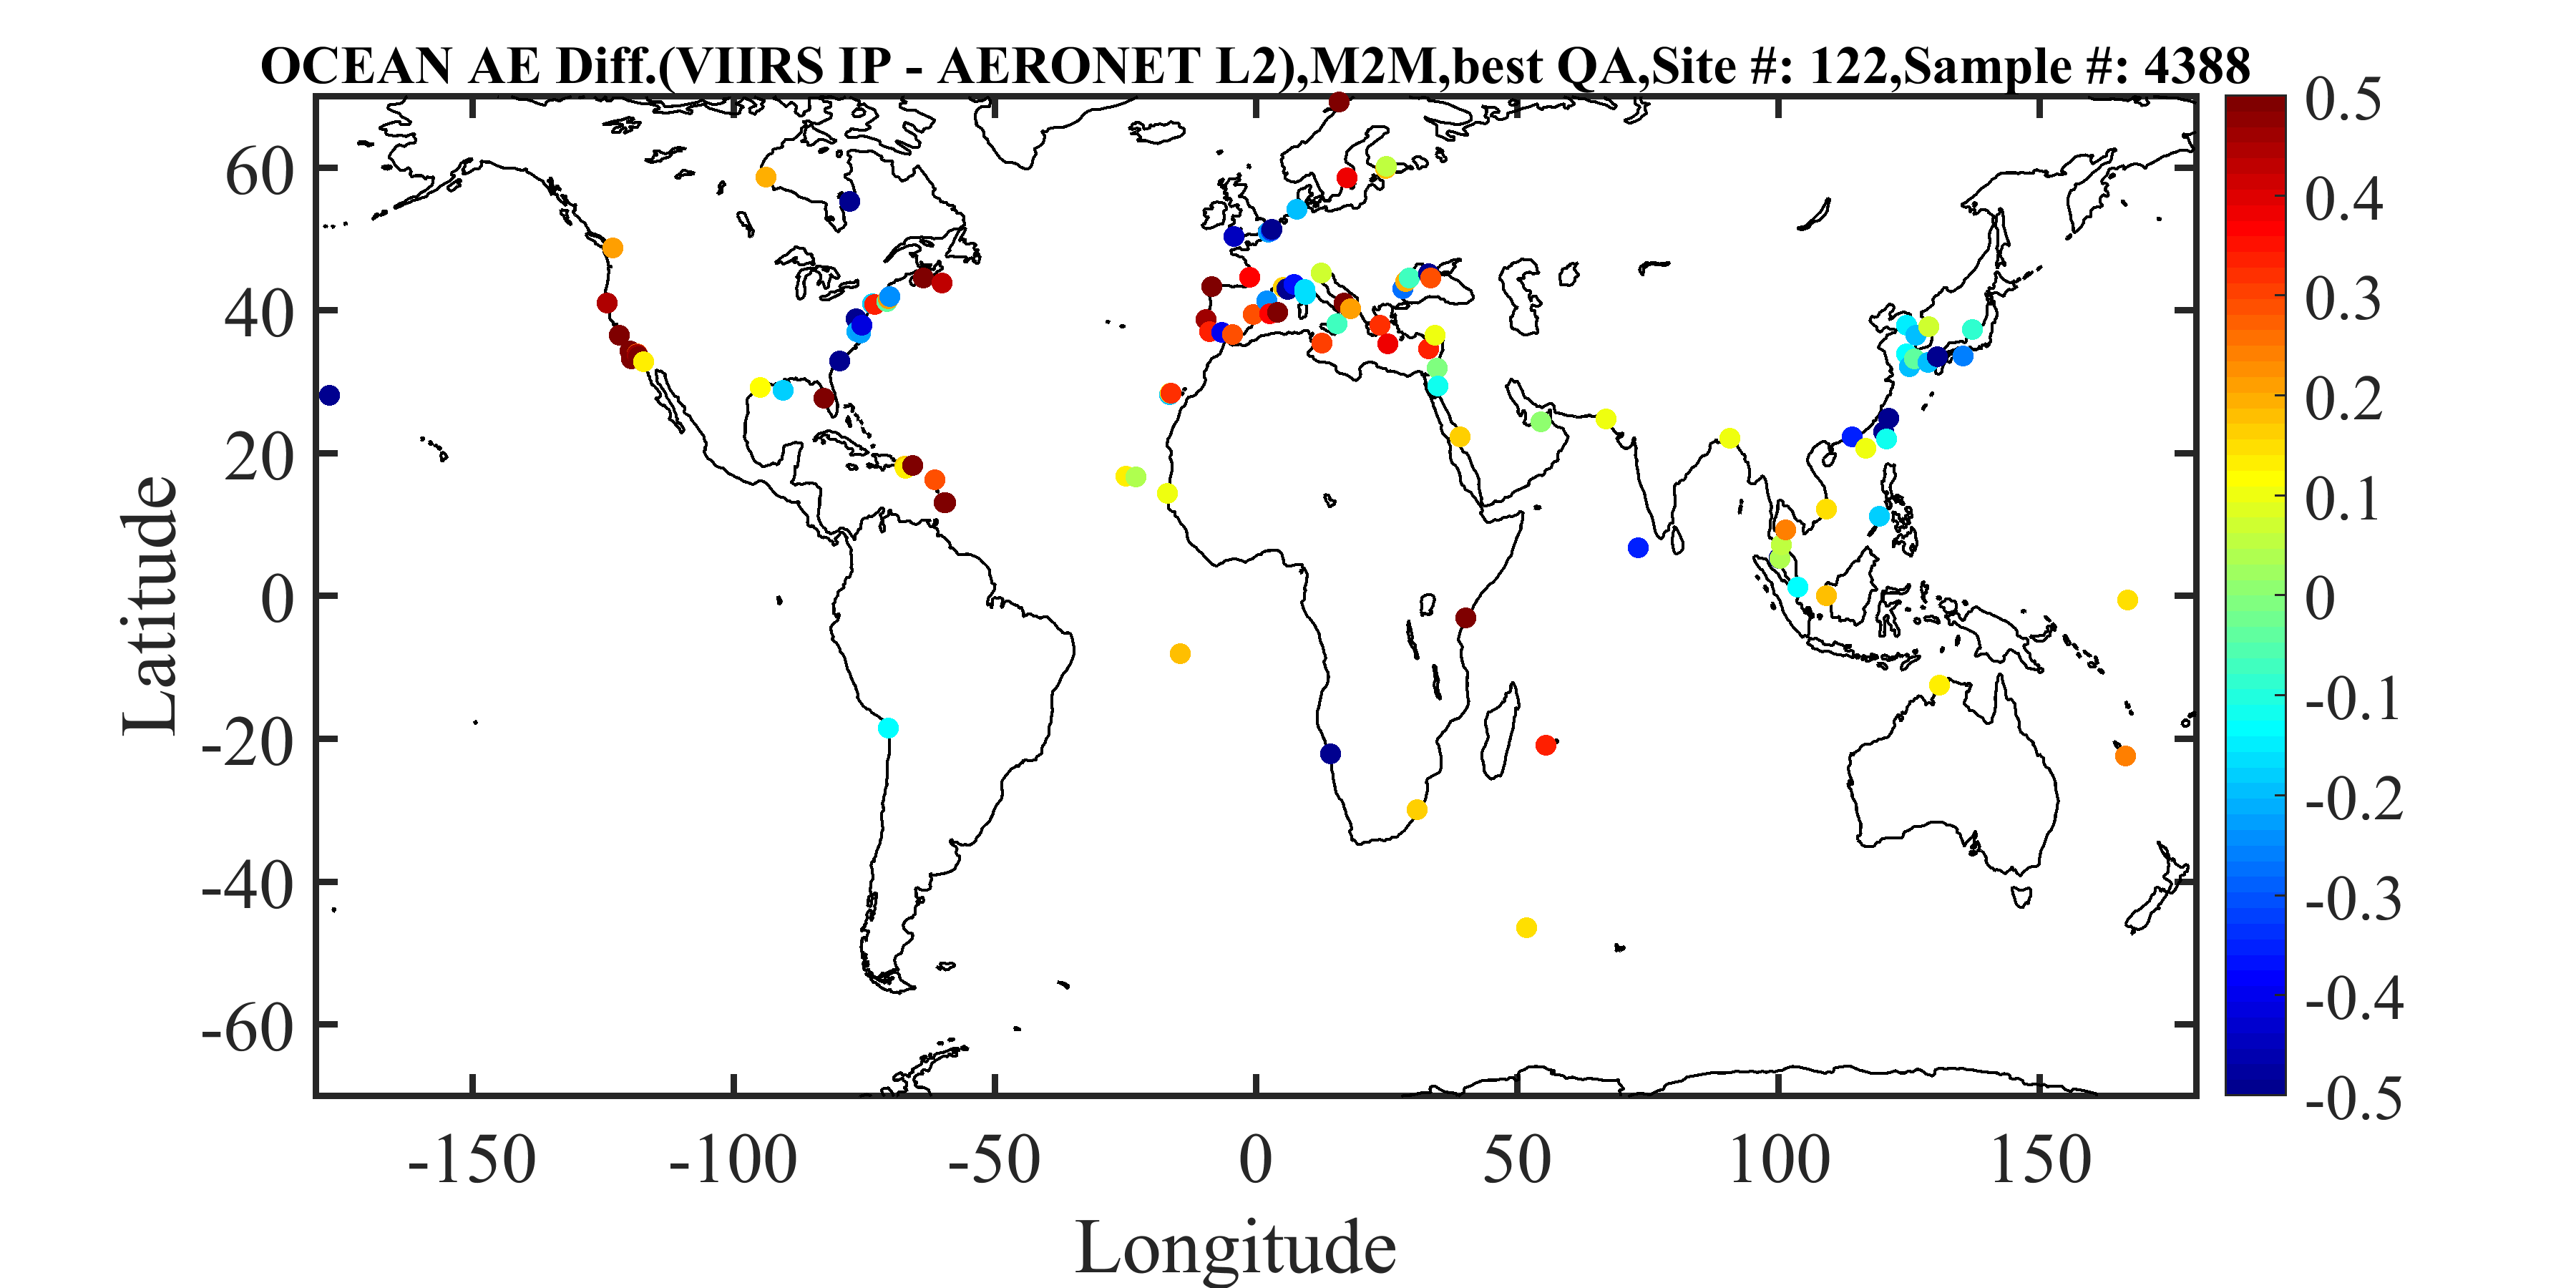
  • Best quality VIIRS retrievals within a radius of 27.5 km centered at an AERONET site are averaged, i.e., Quality Flag (QF) = 0 for IP and QF = 3 for EDR.
  • A minimum of 20% of the total number of pixels within the spatial domain are best quality VIIRS retrievals for both EDR and IP and two AERONET measurements must be available within the spatial and temporal constraints.
For more information on the matching up scheme and the validation results, please see Huang et al.(2016, JGR).


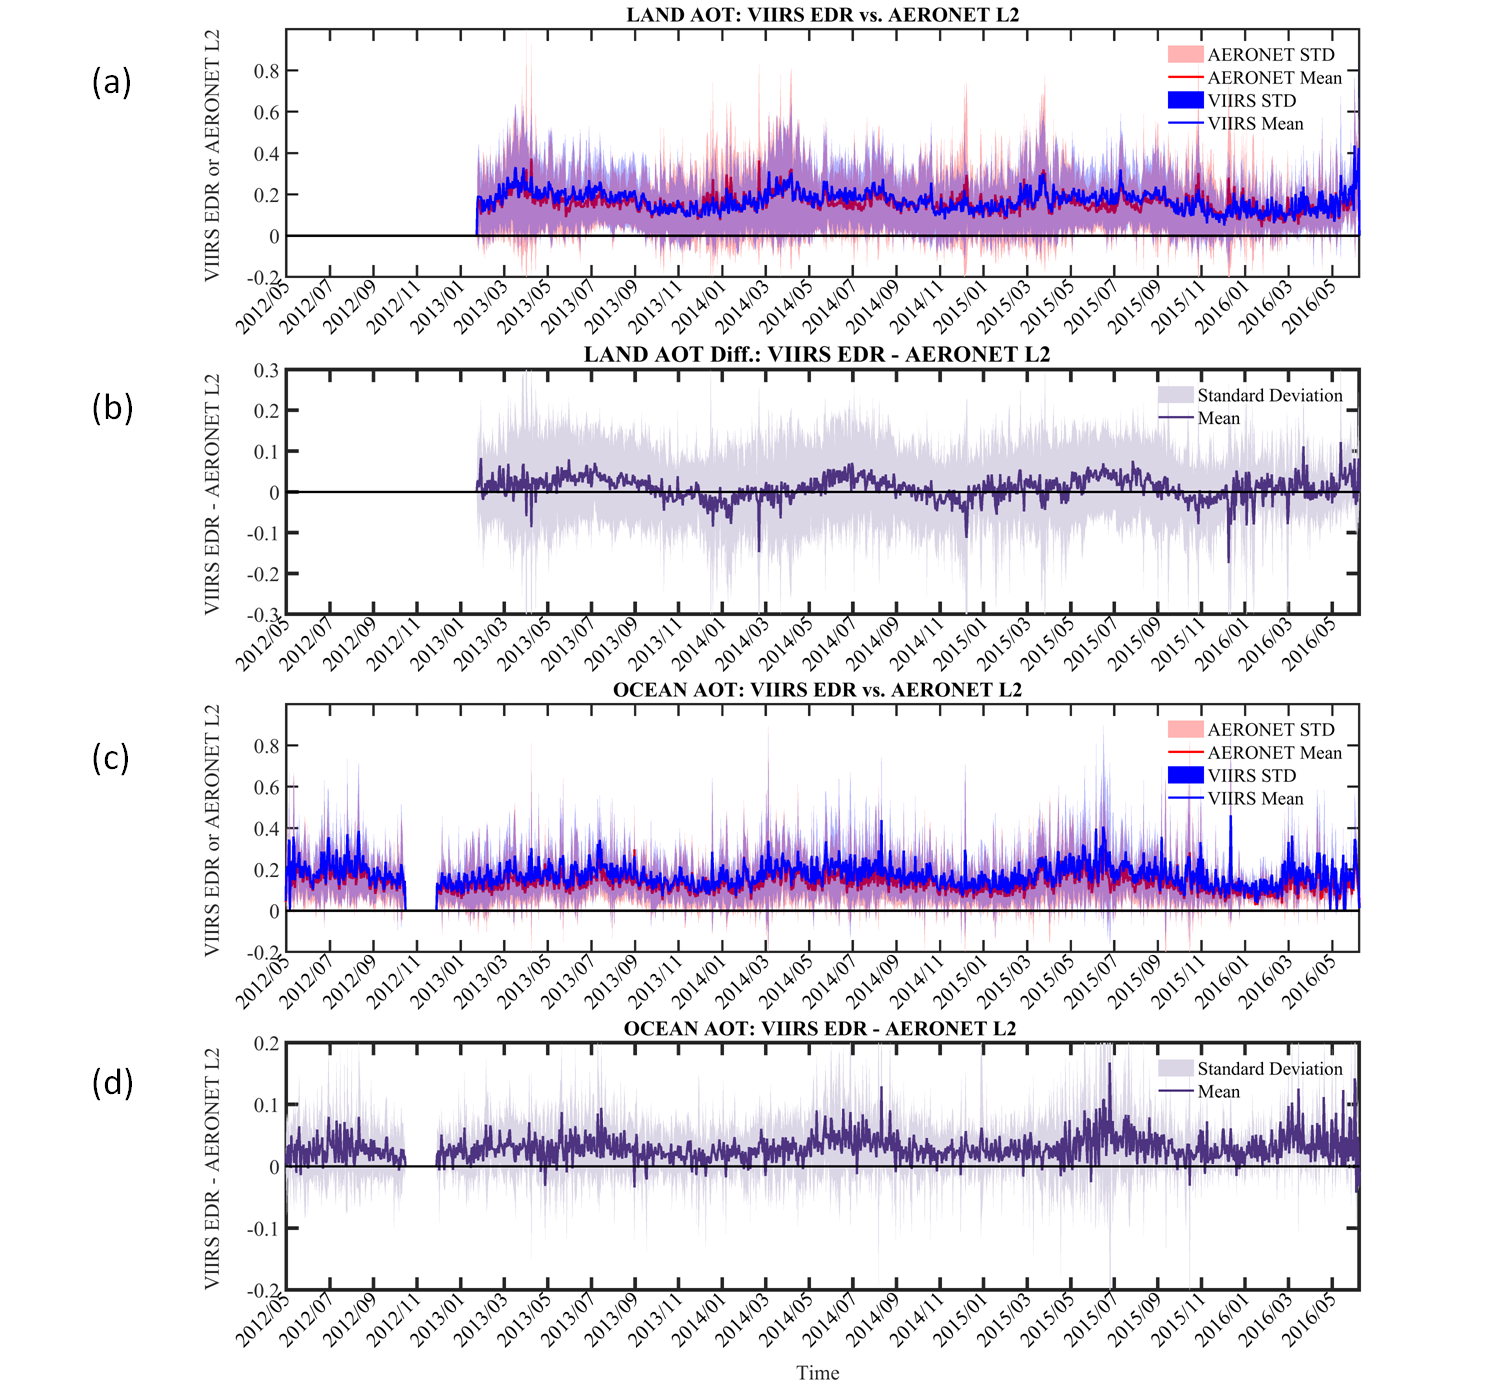
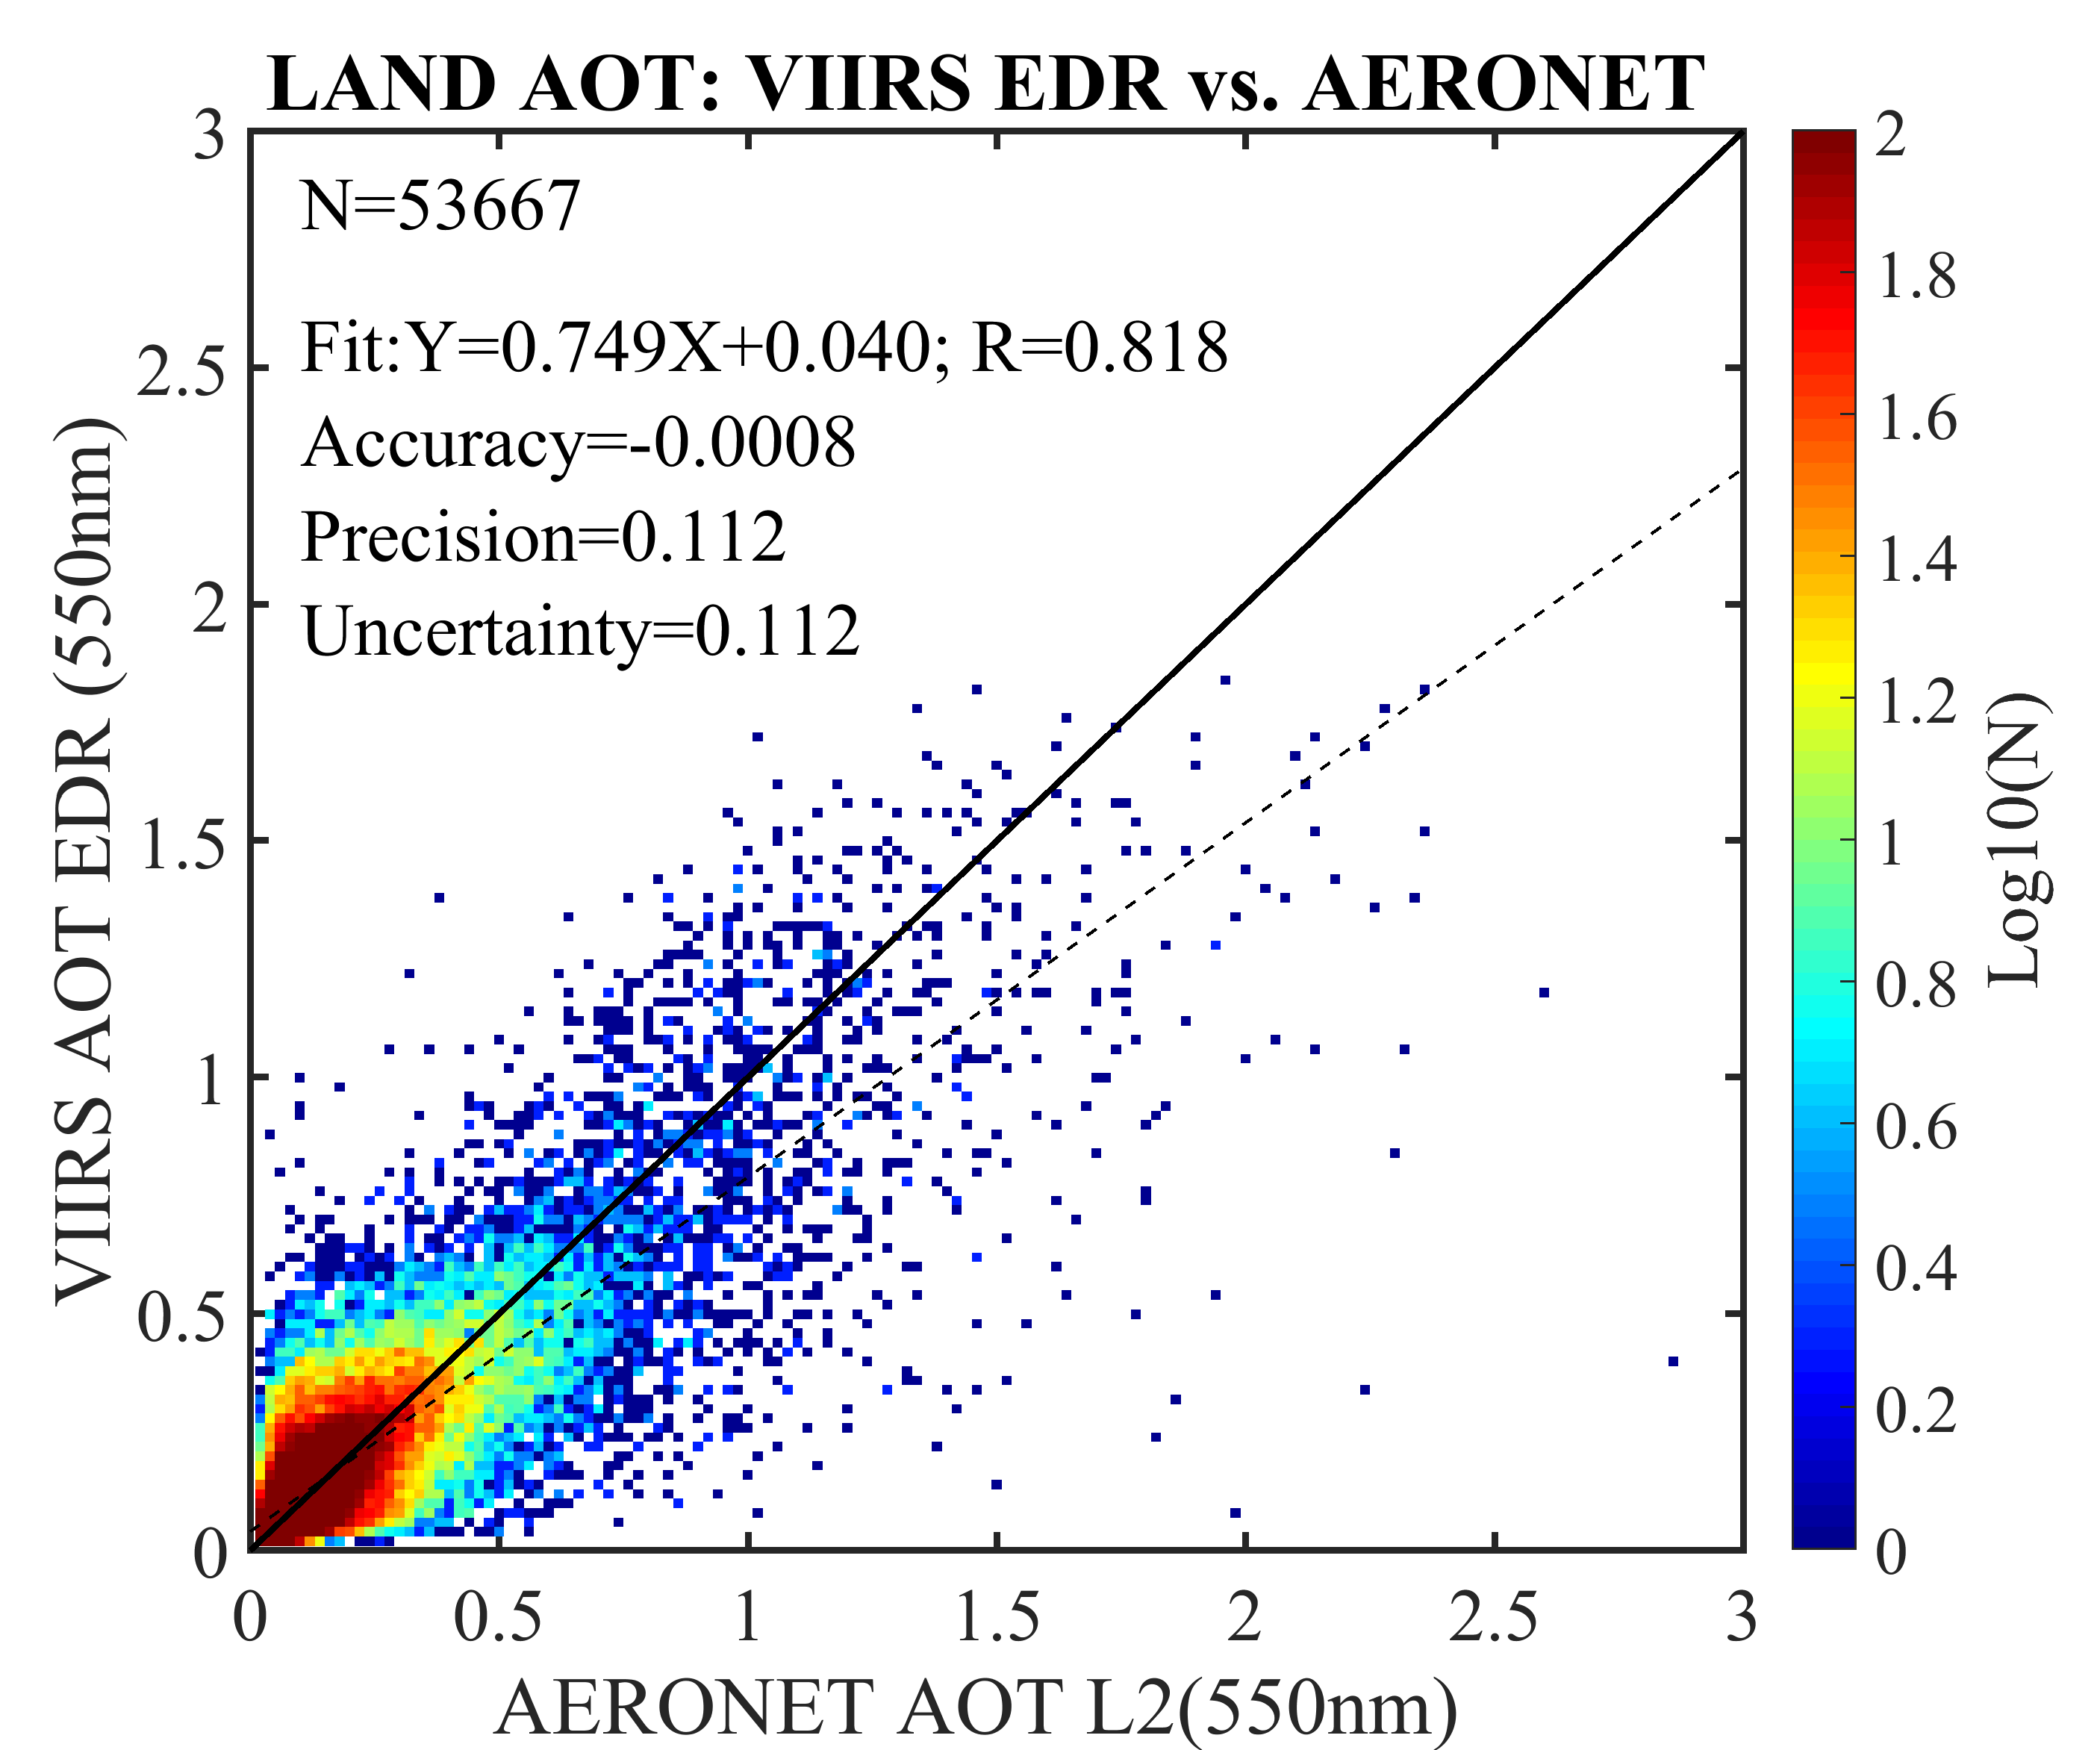
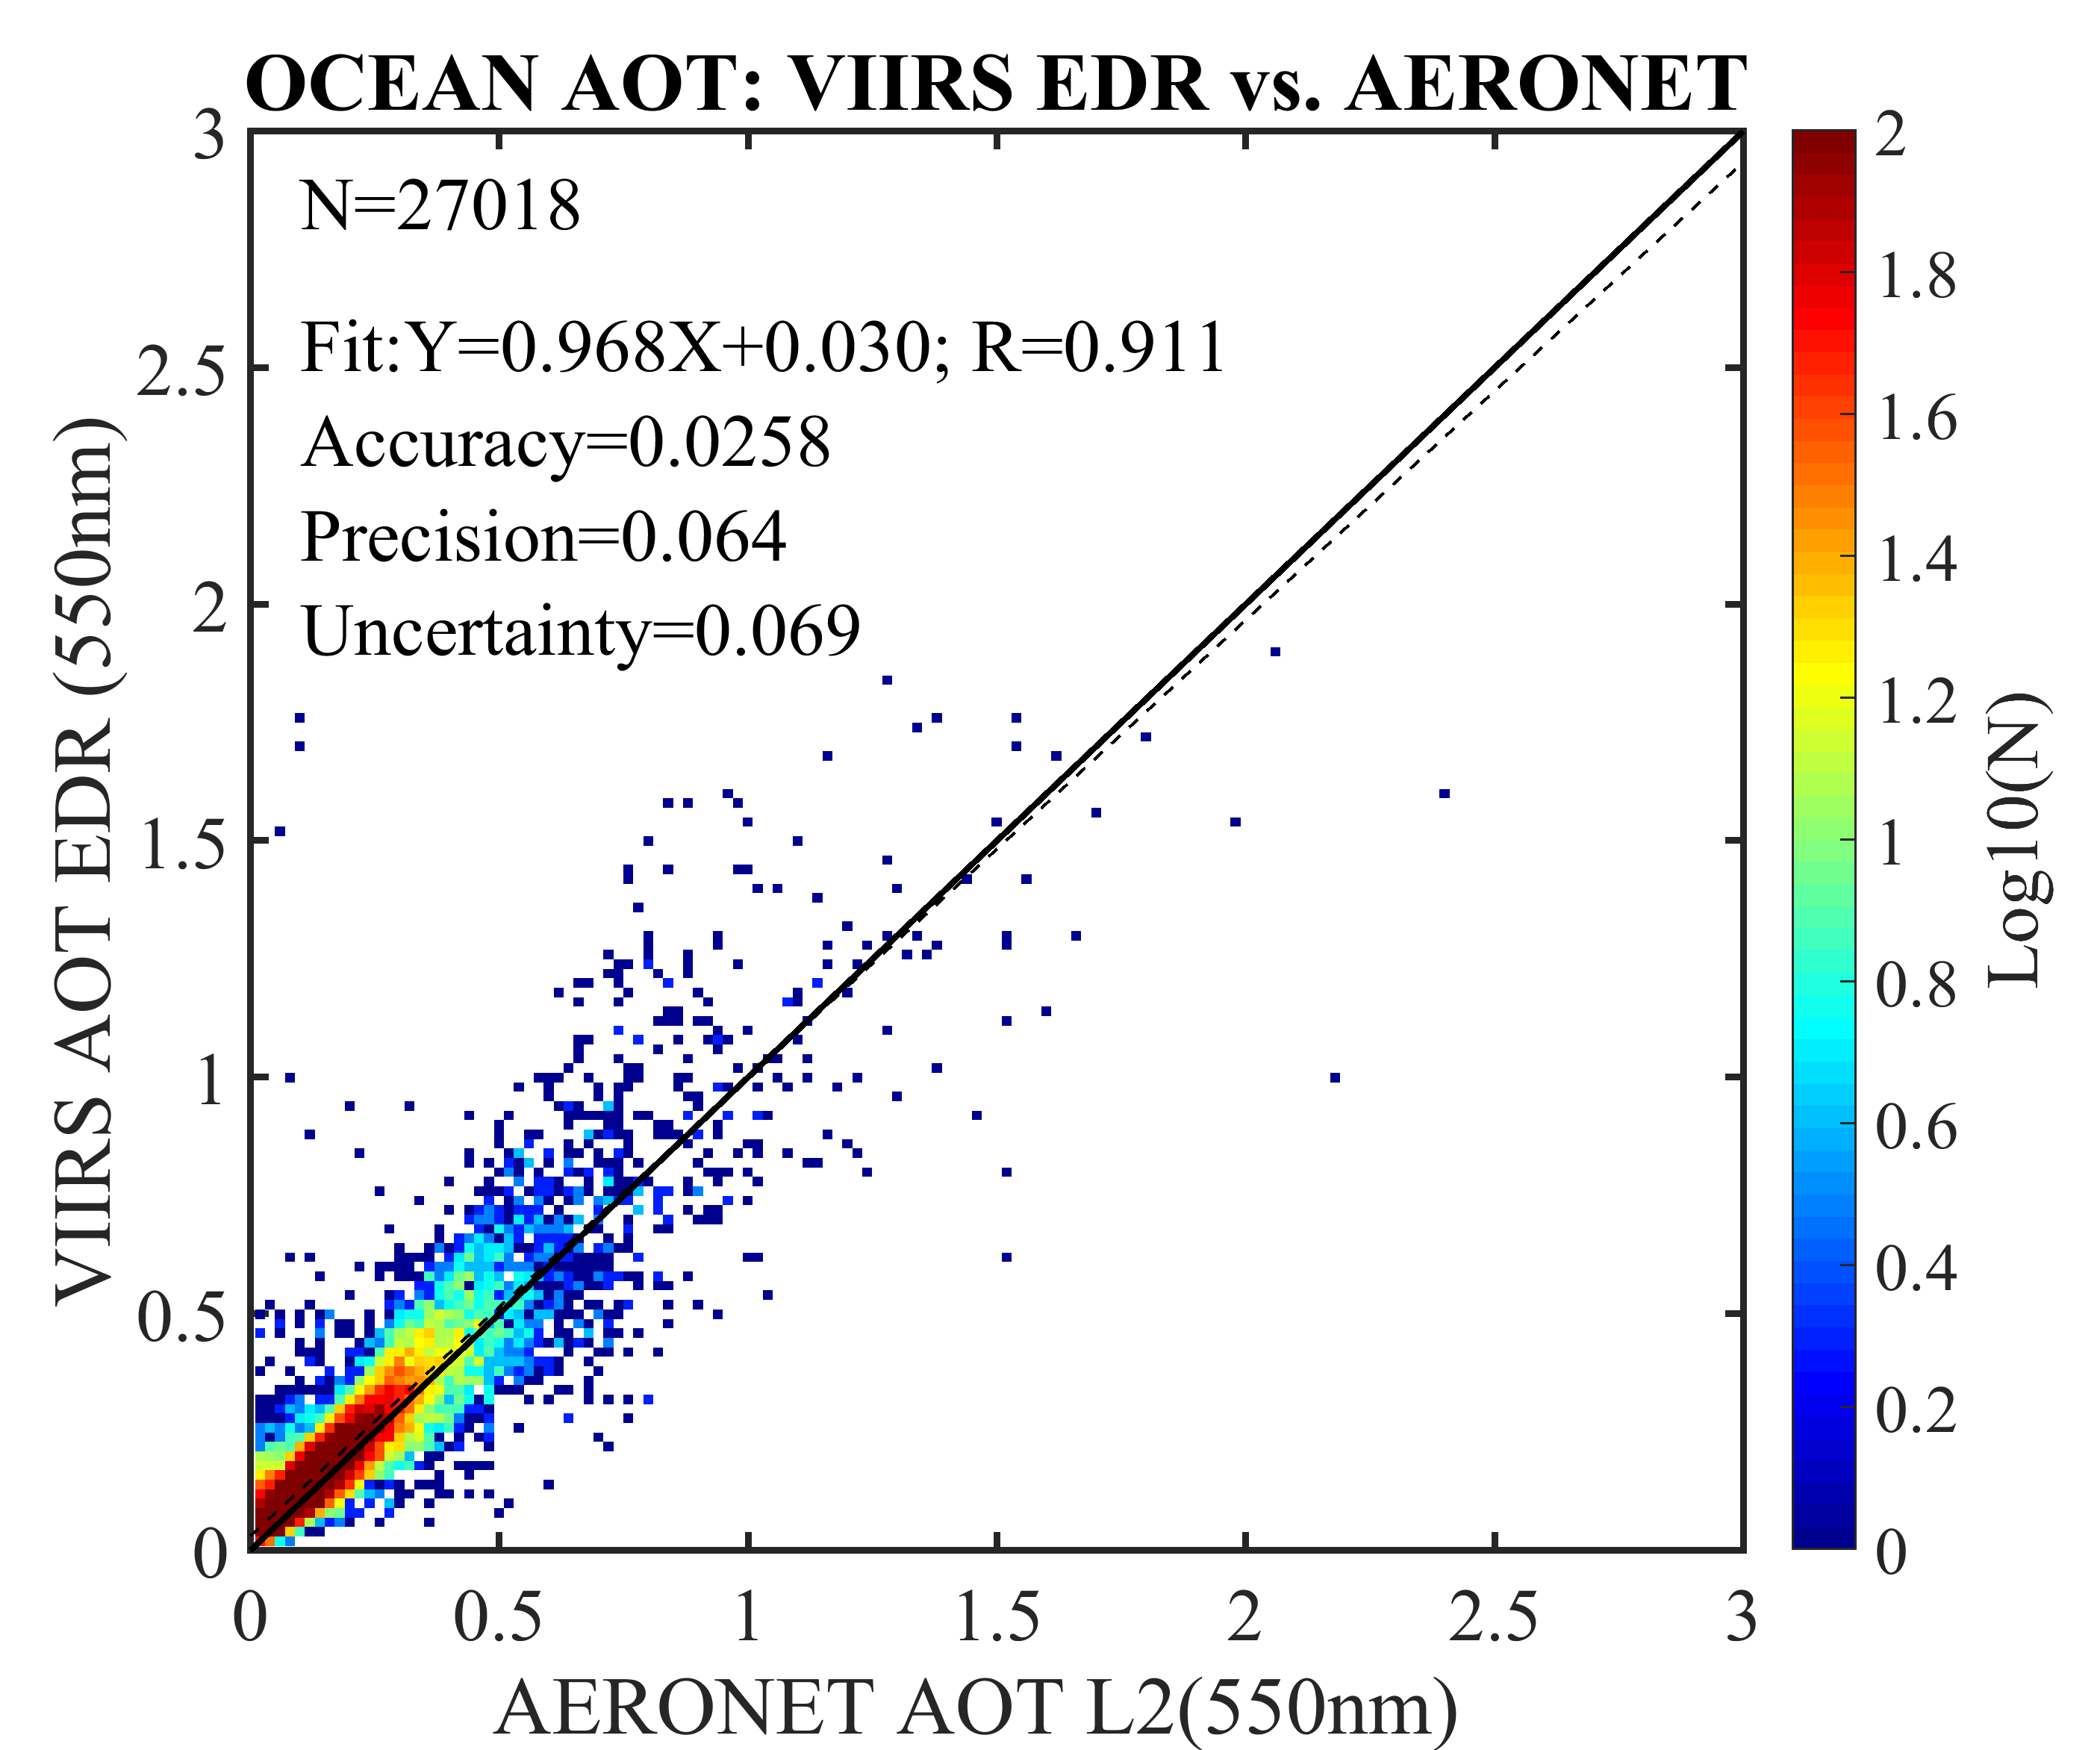
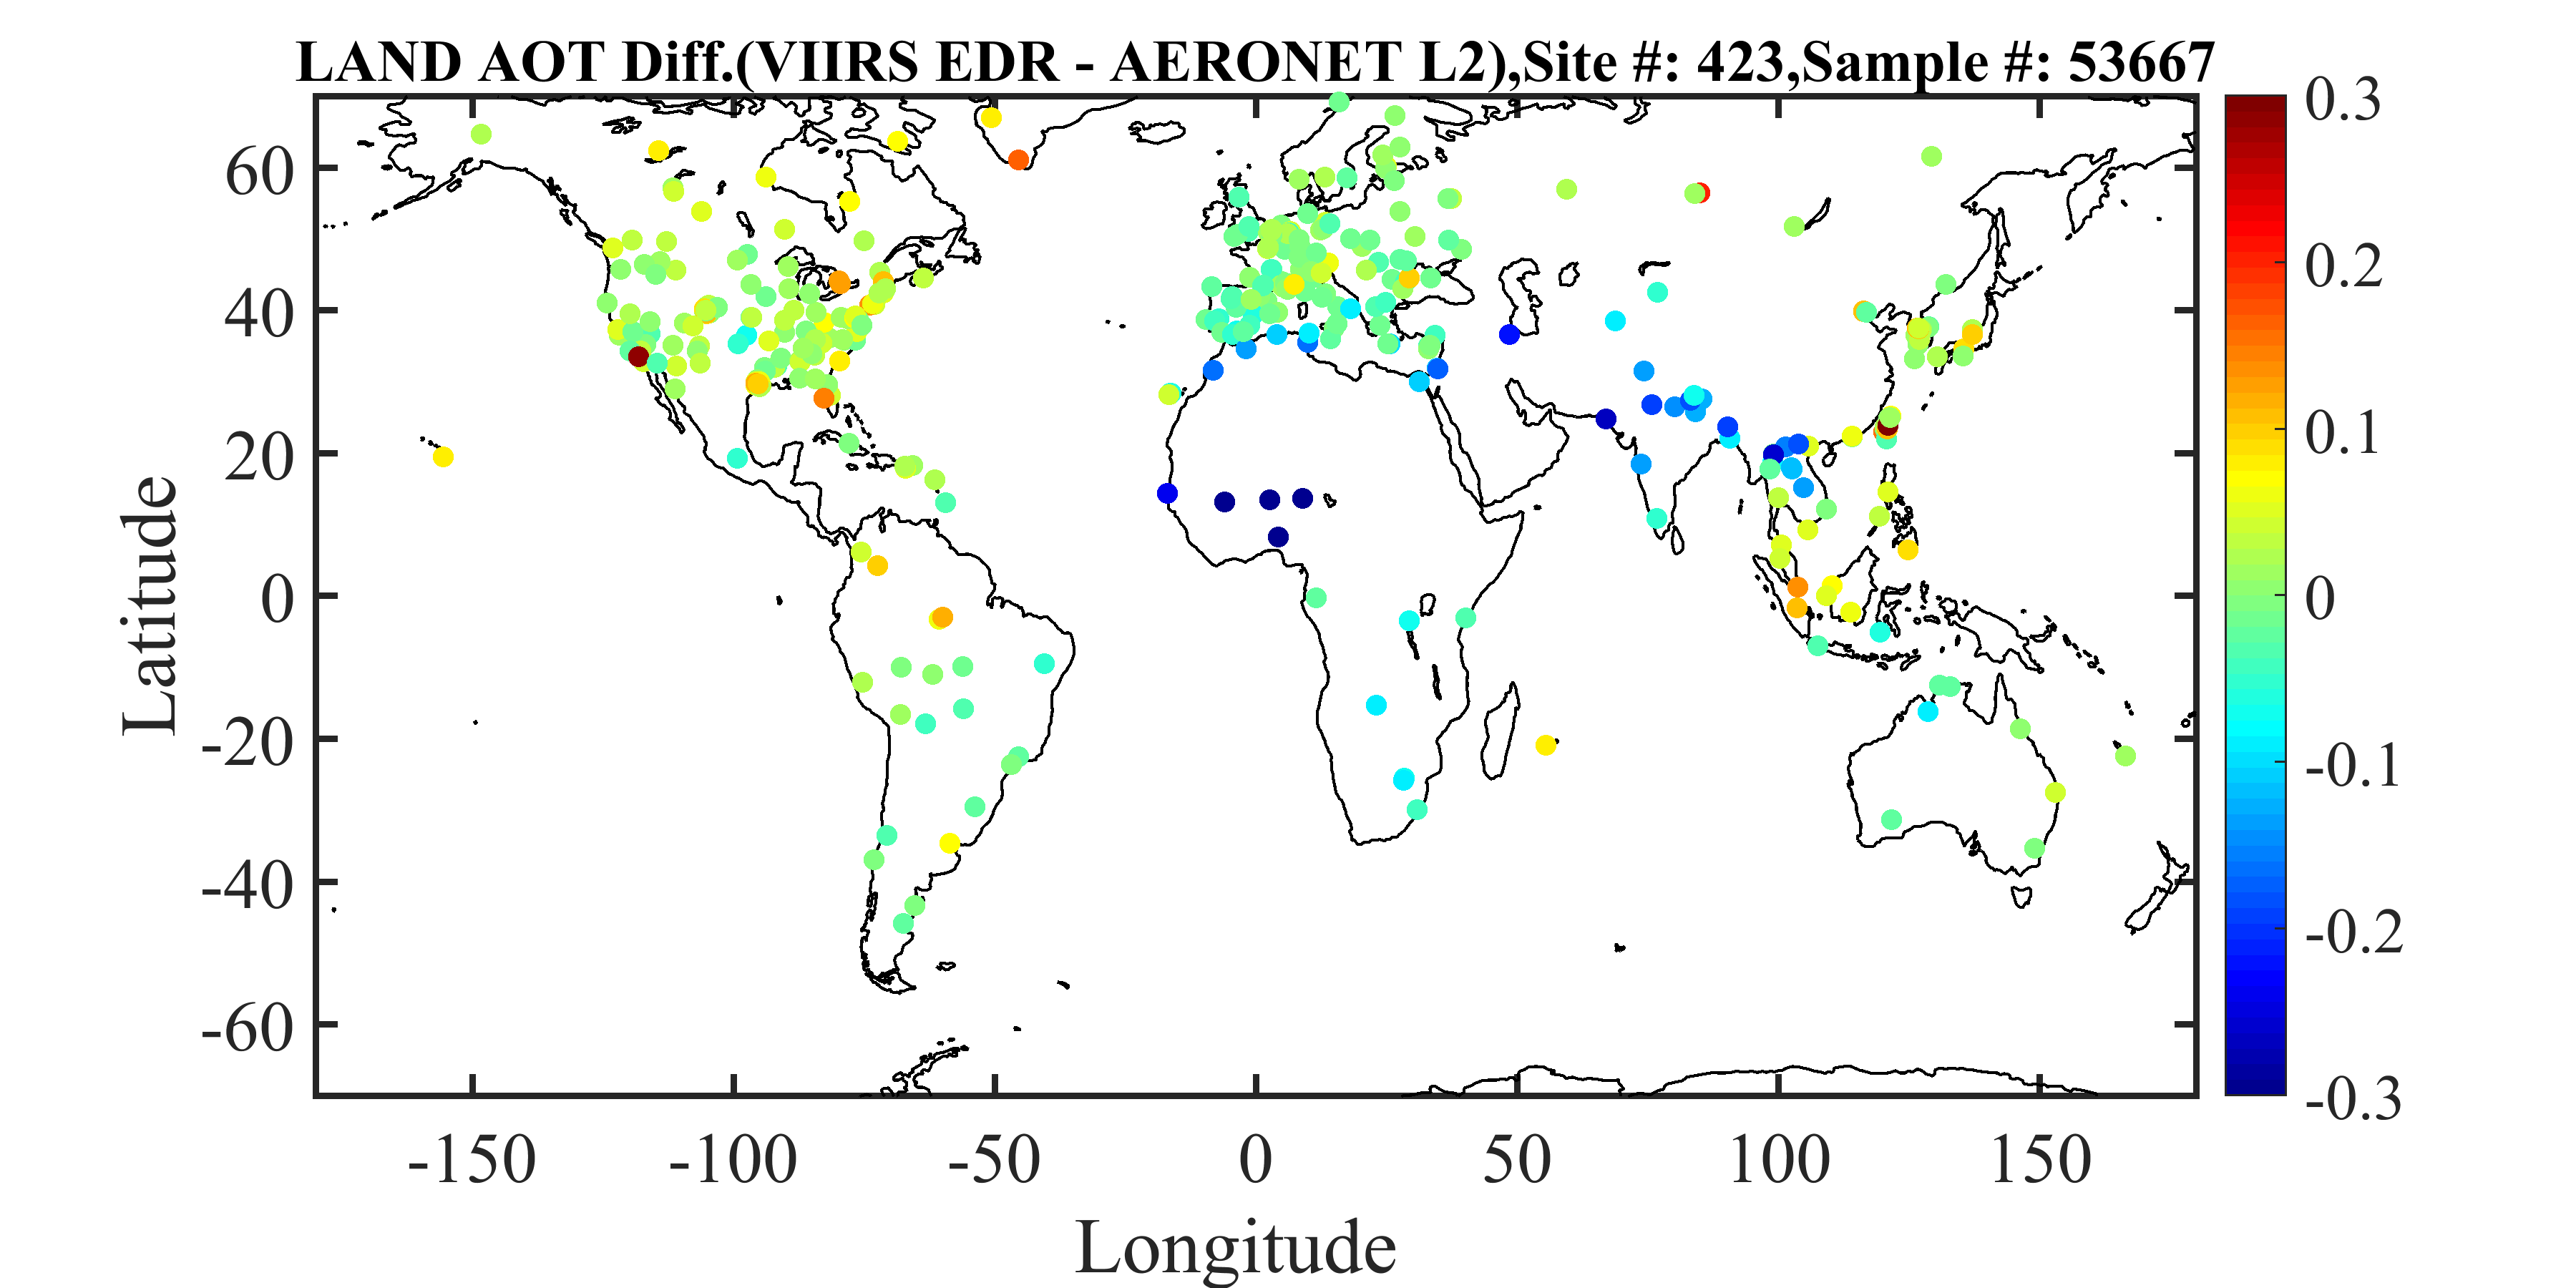
The results shown in the figures below have been obtained following the same match-up scheme and validation approach as described in Huang et al. (2016), but use extended validation data periods: Jan 23, 2013 - May 31, 2016 over land and May 2, 2012 - May 31, 2016 over ocean.


VIIRS High Quality AOT EDR and Angstrom exponent (AE) EDR versus AERONET Level 2 Data

viirs_aeronet_aot_diff_time_series
Figure 1. Time series of globally averaged VIIRS AOT EDR and AERONET L2.0 computed from the matchup data set (a) Land Daily AOT Means, (b) Land Daily AOT Mean Differences, (c) Ocean Daily AOT Mean, and (d) Ocean Daily AOT Mean Differences.

aeronet_aot_edr_land_image aeronet_aot_edr_ocean_image
Figure 2. Comparison between AERONET AOT and VIIRS high quality AOT EDR. Left panel is over land from January 2013 - May 2016 and right panel is over ocean from May 2012 - May 2016. N: number of match-ups

aeronet_aot_loc_edr_land_image aeronet_aot_loc_edr_ocean_image
Figure 3. The geographical distribution of mean AOT difference (VIIRS - AERONET) for over land (left panel) and over ocean (right panel).

aeronet_ae_edr_ocean_image aeronet_ae_loc_edr_ocean_image
Figure 4. (Left)Comparison between AERONET AE and VIIRS high quality AE EDR over ocean from May 2012 - May 2016.(Right)The geographical distribution of mean AE difference (VIIRS - AERONET) over ocean from May 2012 - May 2016. N: number of match-ups

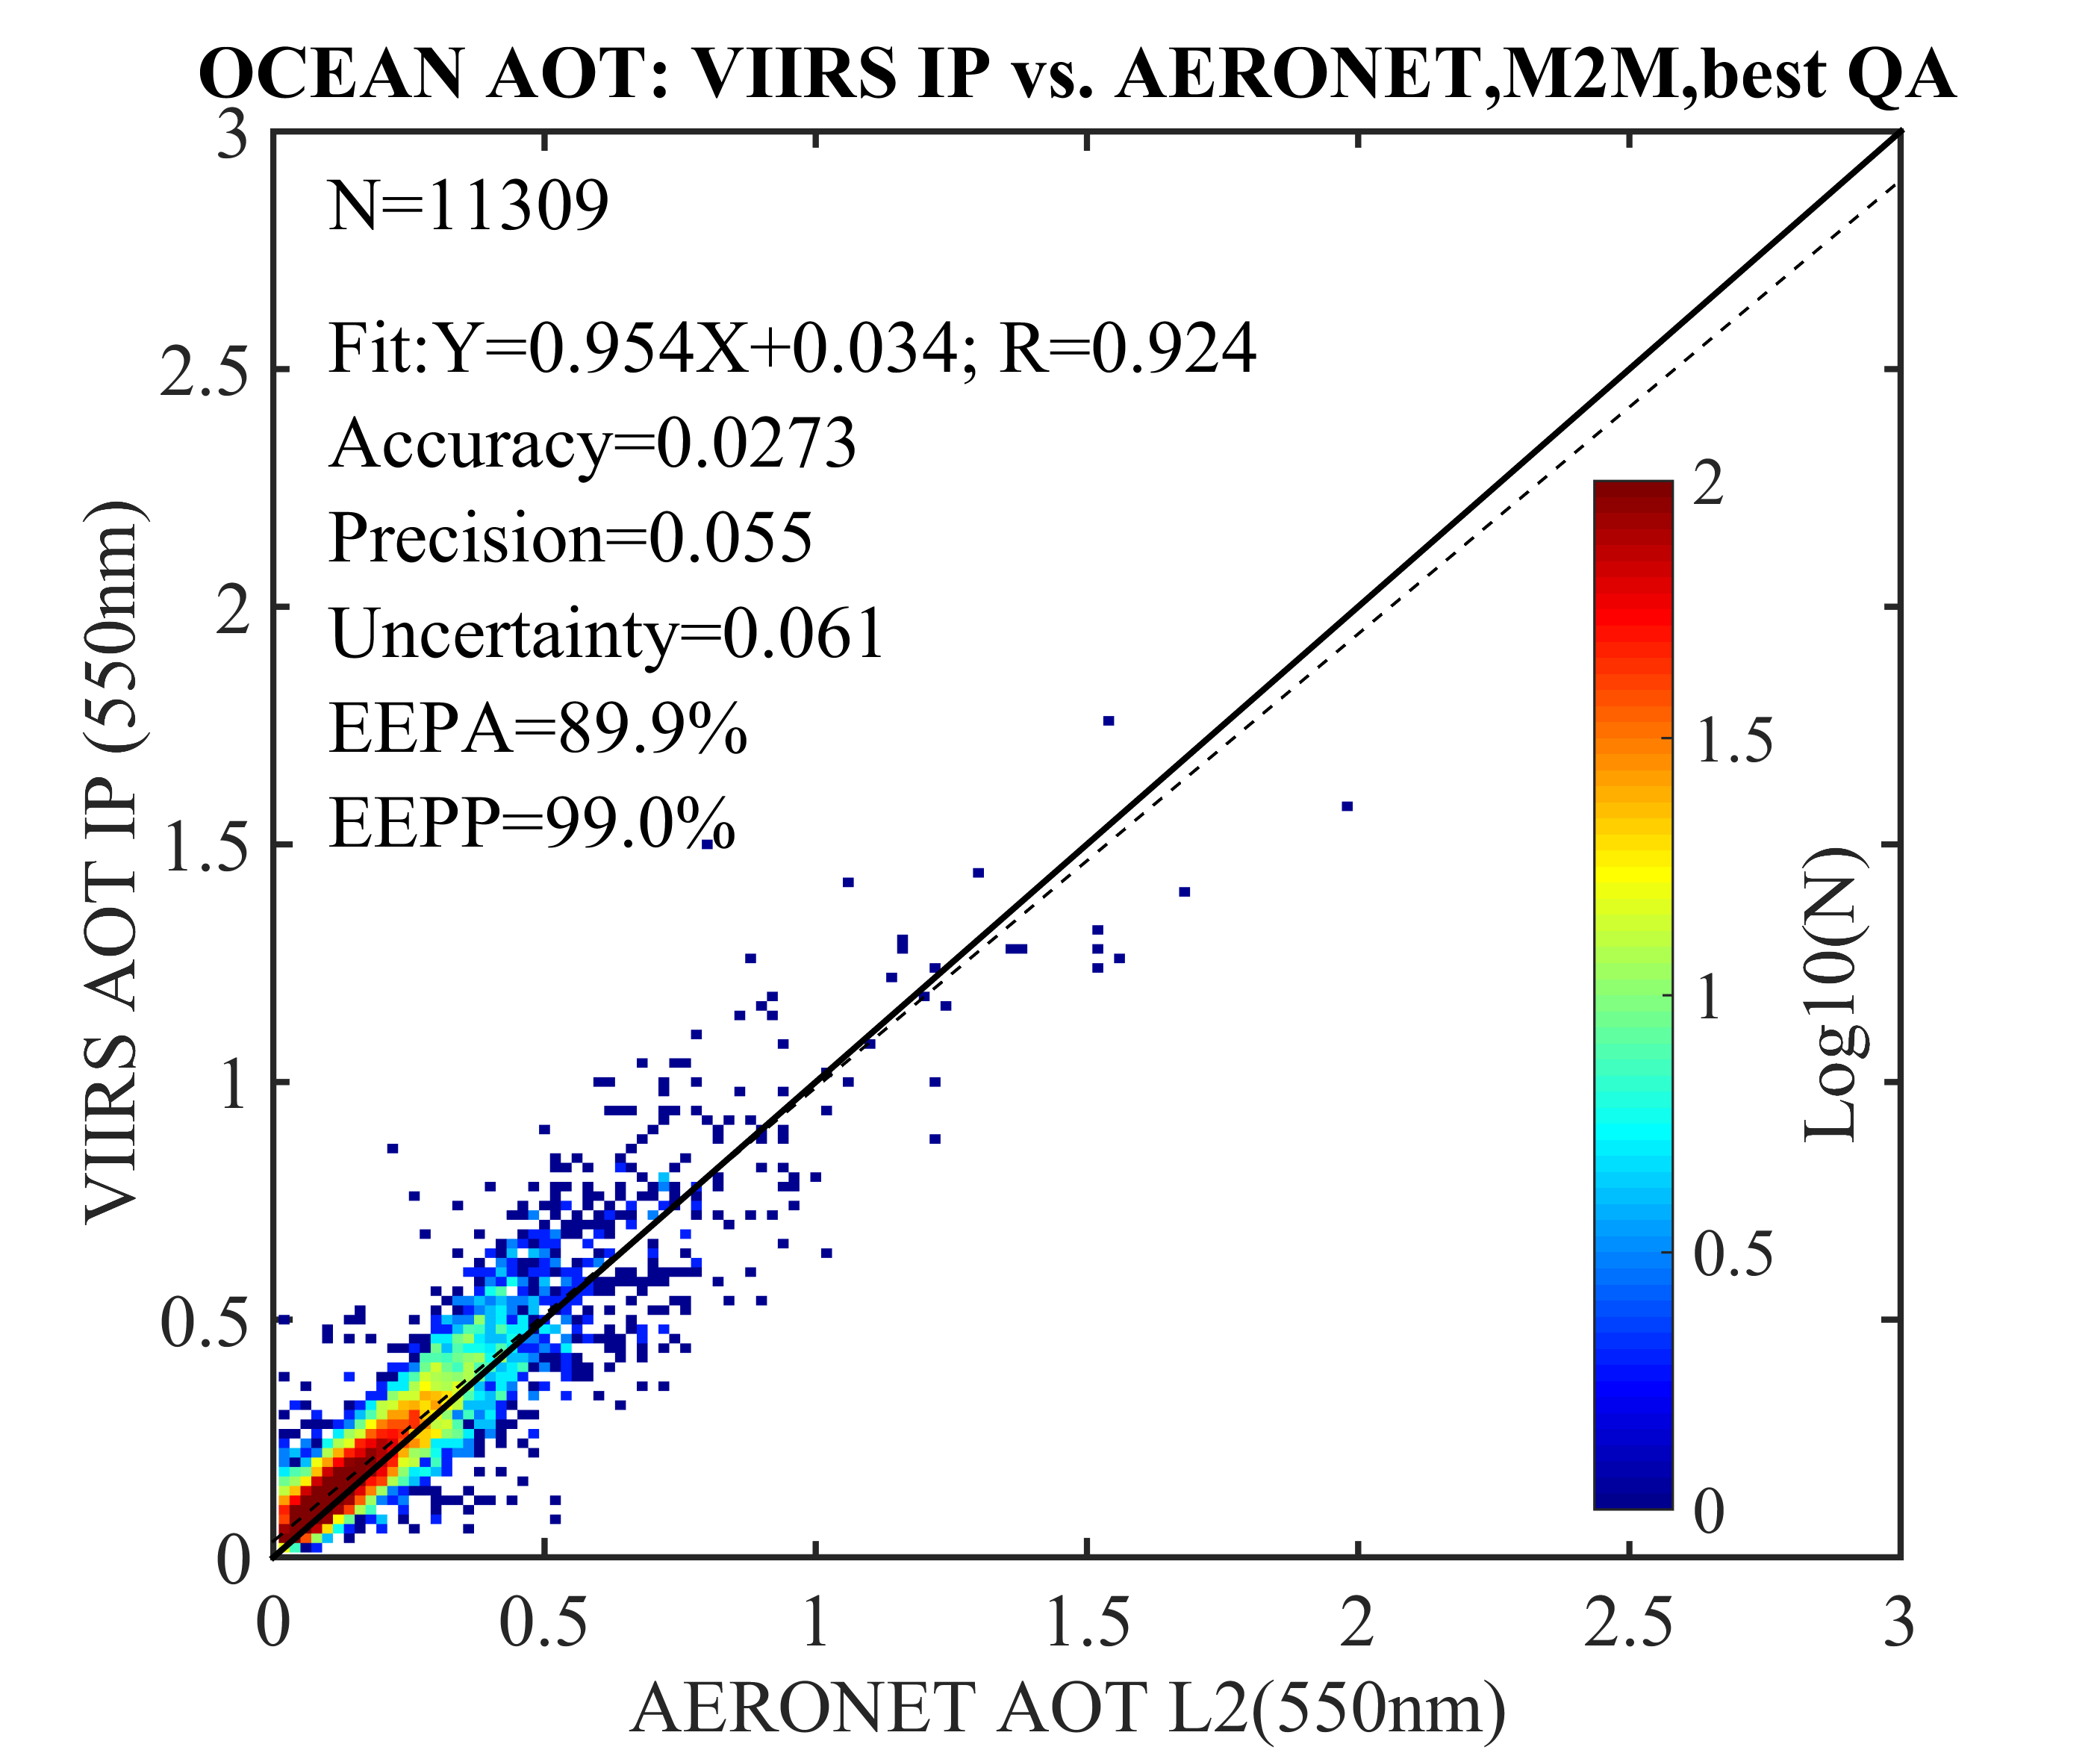
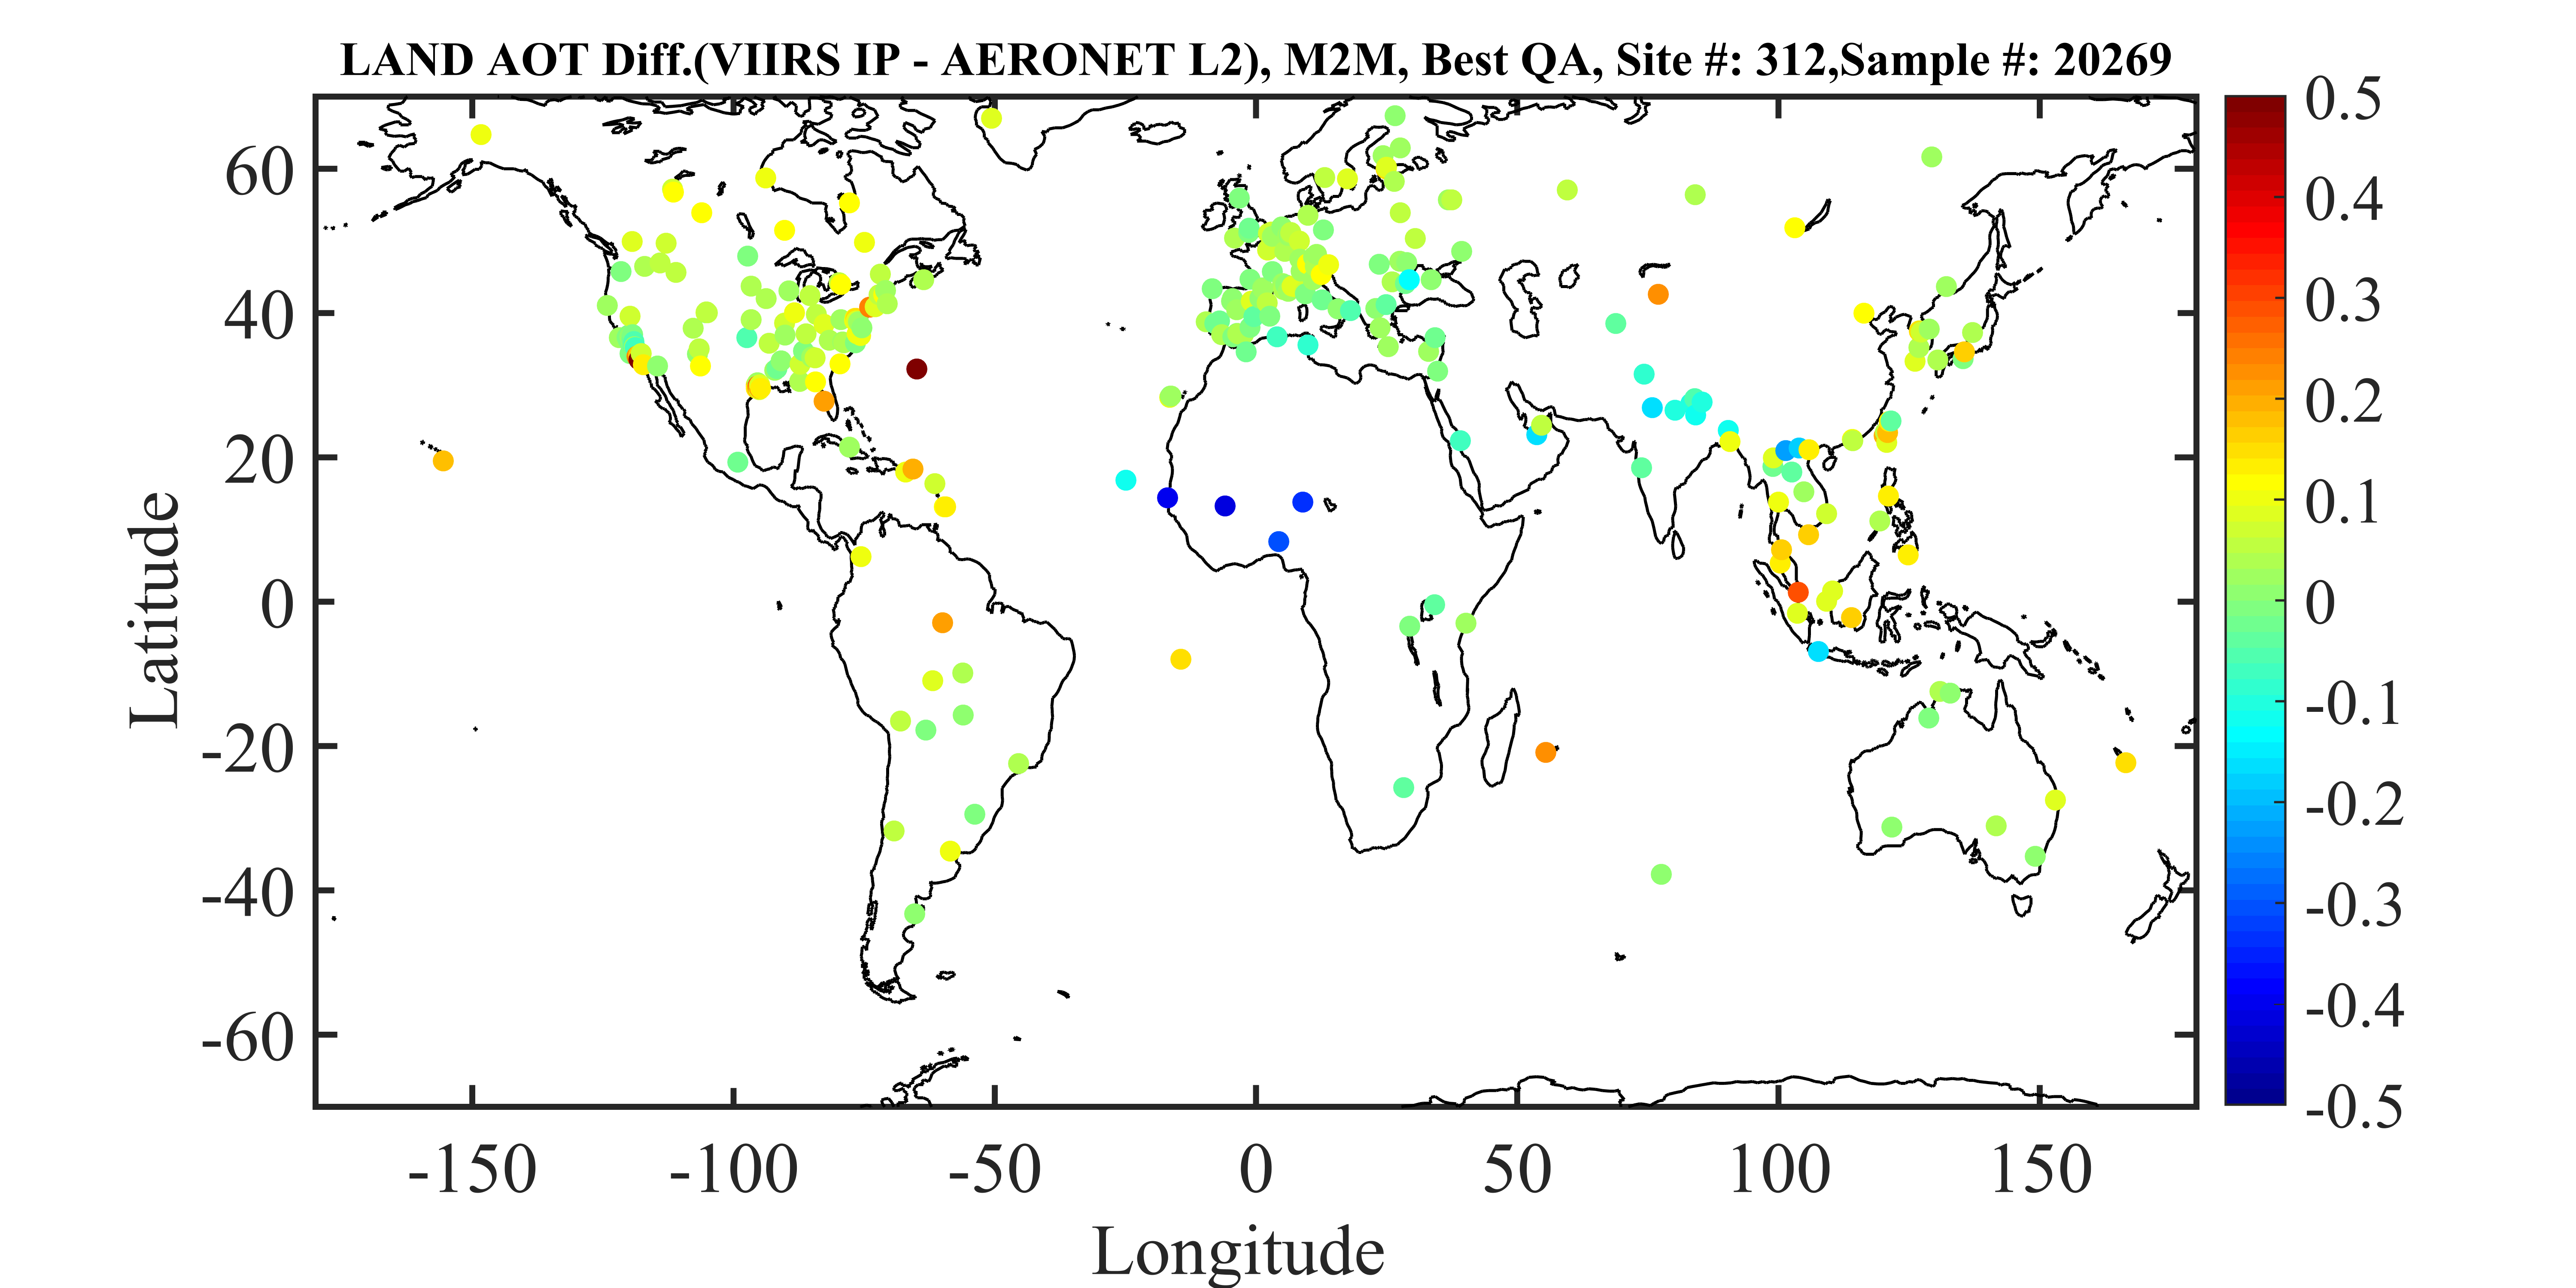
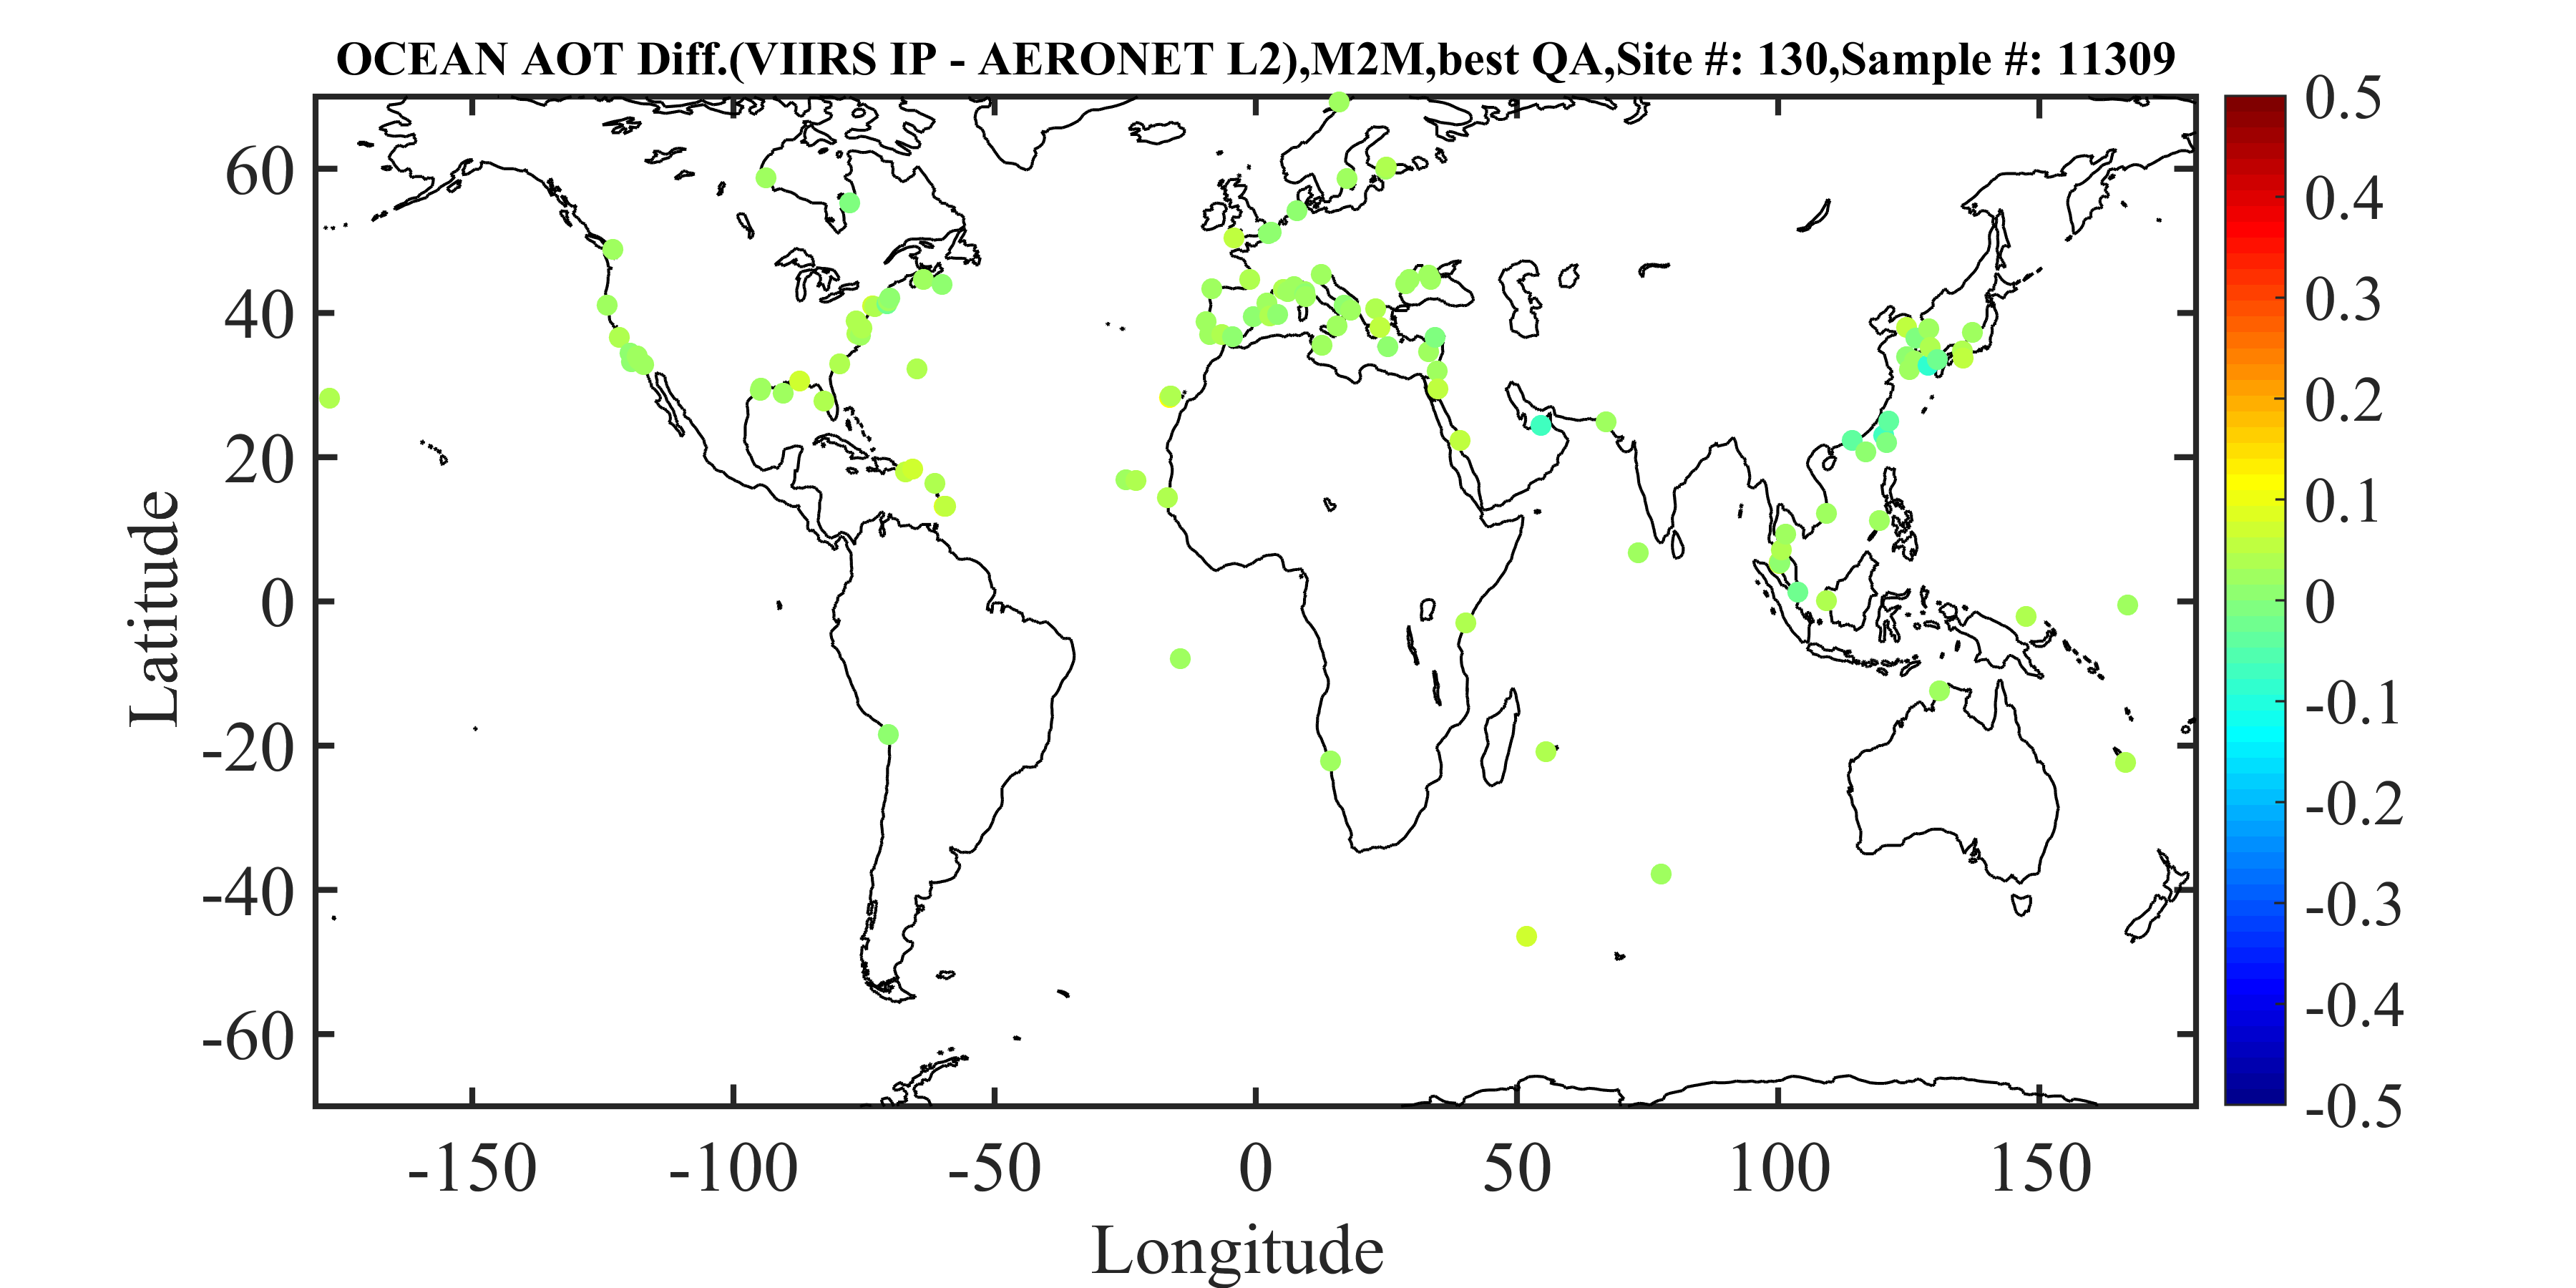
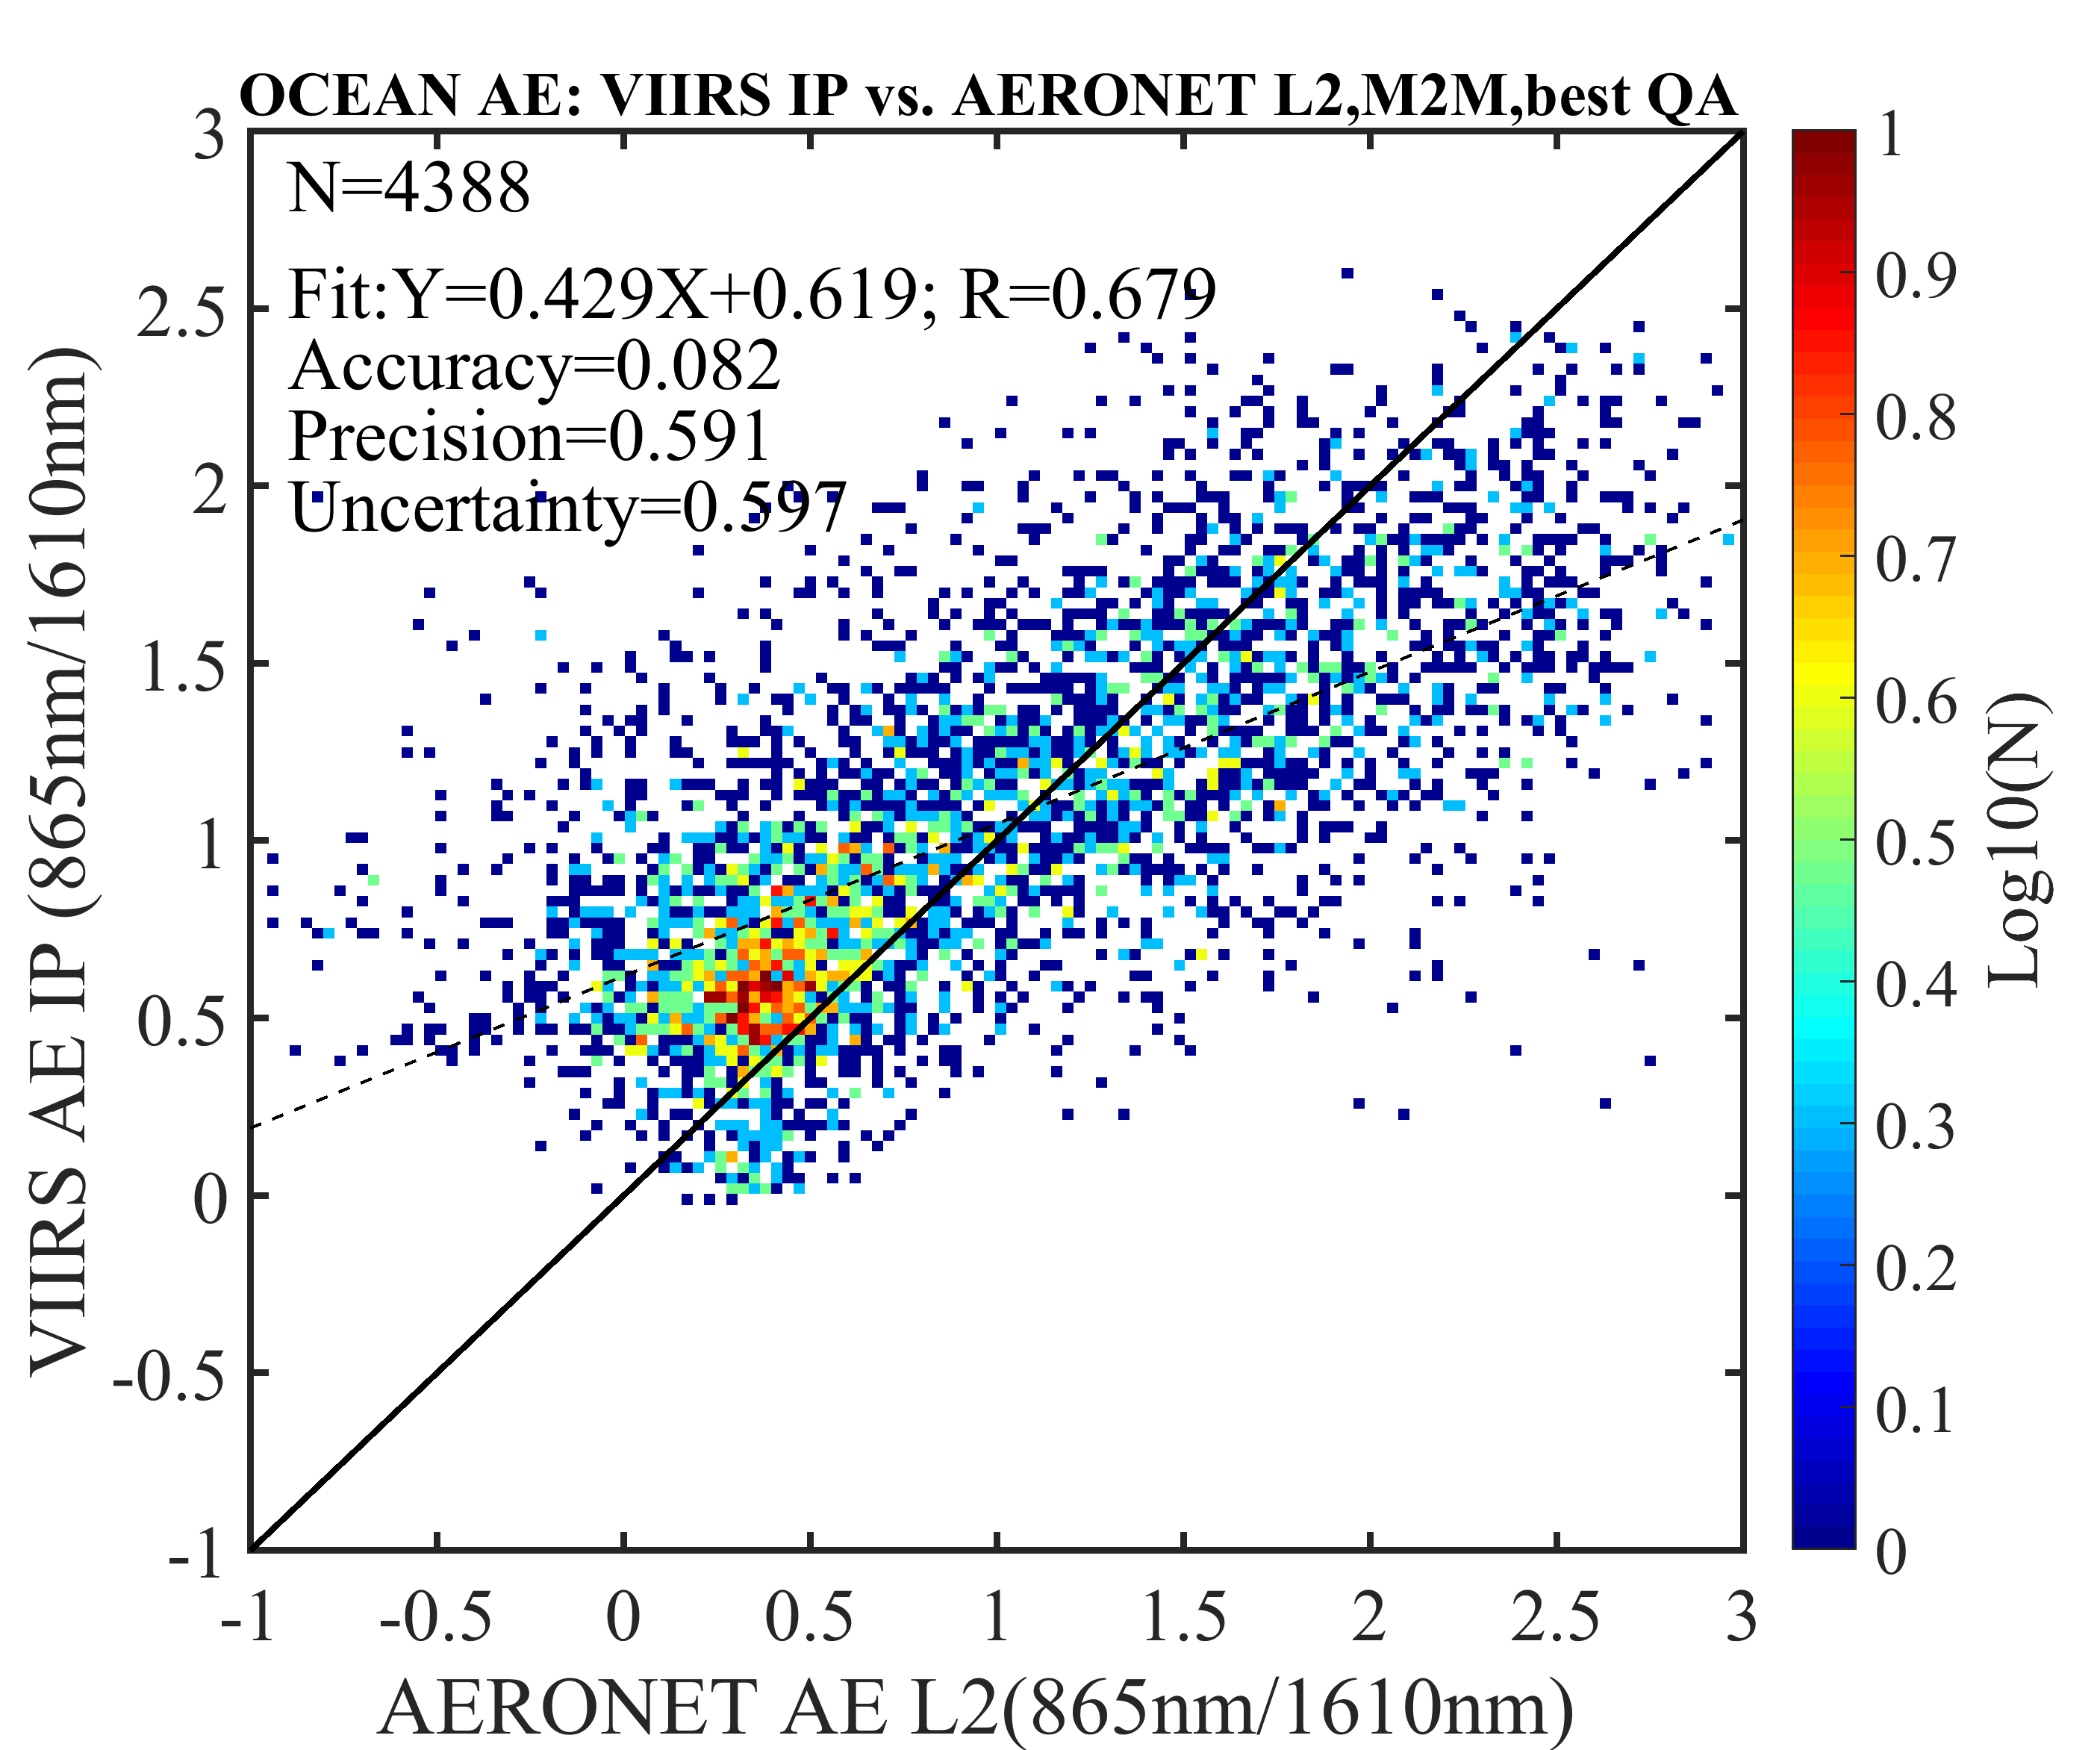
VIIRS High Quality AOT IP and AE IP versus AERONET Level 2 Data

aeronet_aot_ip_land_image aeronet_aot_ip_ocean_image
Figure 5. Comparison between AERONET AOT and VIIRS high quality AOT IP. Left panel is over land from January 2013 - Dec 2014 and right panel is over ocean from May 2012 - Dec 2014. N: number of match-ups

aeronet_aot_loc_ip_land_image aeronet_aot_loc_ip_ocean_image
Figure 6. The geographical distribution of mean AOT difference (VIIRS IP - AERONET) for over land (left panel) and over ocean (right panel).

aeronet_ae_ip_ocean_image aeronet_ae_loc_ip_ocean_image
Figure 7. (Left) Comparison between AERONET AE and VIIRS high quality AE IP over ocean from May 2012 - Dec 2014.(Right) The geographical distribution of mean AE difference (VIIRS IP - AERONET) over ocean from May 2012 - Dec 2014.

References

Huang, J., S. Kondragunta, I. Laszlo, H. Liu, L. A. Remer, H. Zhang, S. Superczynski, P. Ciren, B. N. Holben, and M. Petrenko, 2016: Validation and expected error estimation of Suomi-NPP VIIRS aerosol optical thickness and Angstrom exponent with AERONET, J. Geophys. Res., 121, 7139-7160, doi: 10.1002/2016JD024834.

Petrenko, M., Ichoku, C., and Leptoukh, G.: Multi-sensor Aerosol Products Sampling System (MAPSS), Atmos. Meas. Tech., 5, 913-926, doi:10.5194/amt-5-913-2012, 2012