
Tropical SAR Winds Technical Document
Geophysical Model Functions
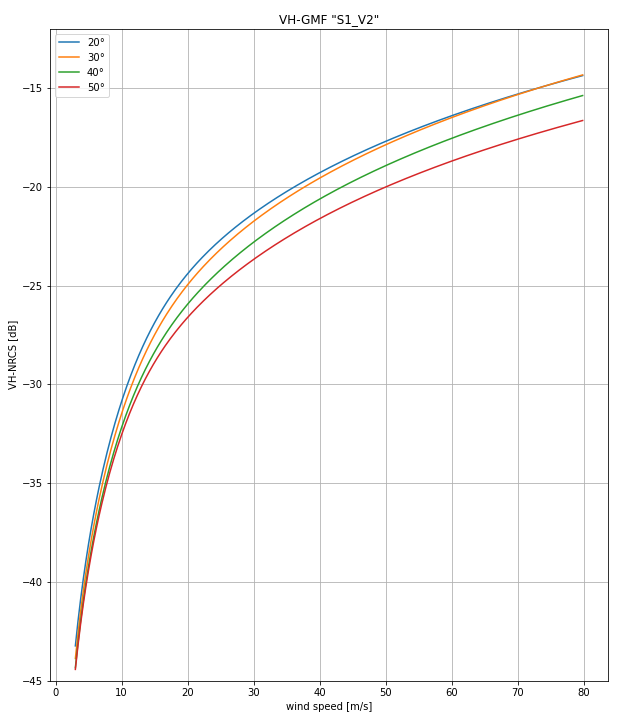
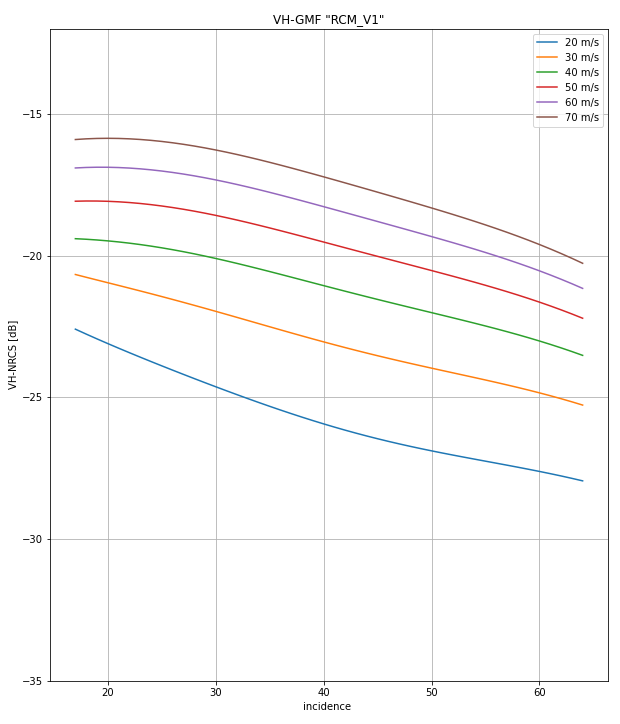
SAR tropical cyclone ocean surface wind speeds are produced by converting the measured Cross-Polarization (VH or HV) normalized radar cross section (NRCS) backscatter via a specially developed geophysical model function (GMF). These GMFs are all empirically derived by matching the SAR observations to (presumed) valid winds speeds from a different source (e.g. SFMR, SMAP, SMOS) and then best fitting the parameters of the SAR cross-pol GMF. The original Sentinel-1 model is detailed in Mouche et al. 2019, but since its publication revised satellite specific GMFs have been developed. Figures 1 to 4 show how the NRCS varies as a function of either wind speed or incidence angle for the current Sentinel-1 and Radarsat-2 GMFs. The plots show higher wind speeds produce higher NRCS returns, and increasing angle of incidence results in decreased NRCS values. A properly developed GMF compensates for both these effects producing an accurate wind speed retrieval for a given measured NRCS value. A comparison of SAR/SMAP and SAR/SMOS observations can be found on the CYCLOBS Tropical Cyclone website.
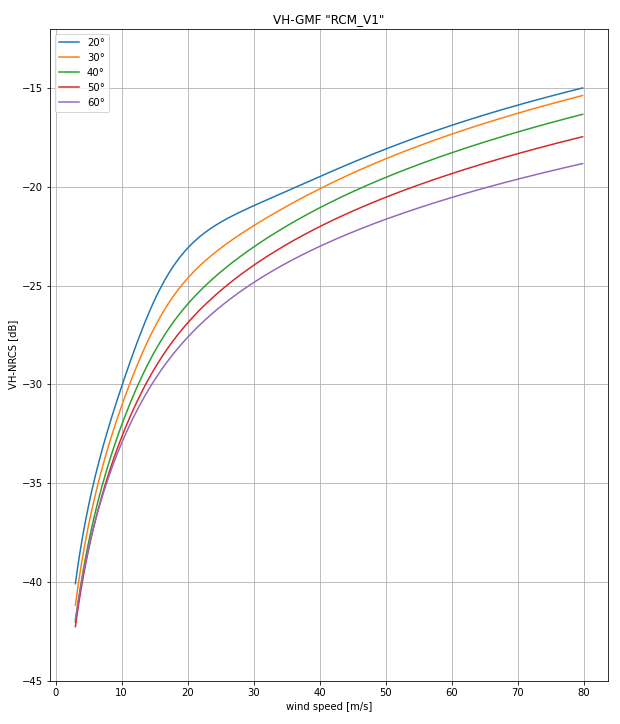
A new RCM-specific GMF was developed by STAR in 2023 and initially was applied to RCM imagery after August 2023. From June through August 2023, RCM data had been processed using the revised Sentinel-1 GMF, and prior to then they had been processed using the original Sentinel-1 or Radarsat-2 GMFs. Figures 5 and 6 show similar information for the new RCM-specific GMF. As of January 2024, the entire tropical winds archive has been reprocessed with the latest GMFs described in this document for each sensor, designated C-10 for Sentinel-1, C-11 for Radarsat-2, and C-12 for RCM on the STAR Tropical Winds Webpage and in the product filenames.
Sentinel-1 Cross-Polarization Geophysical Model Function (July 2023) (Courtesy of Alexis Mouche IFREMER) | |
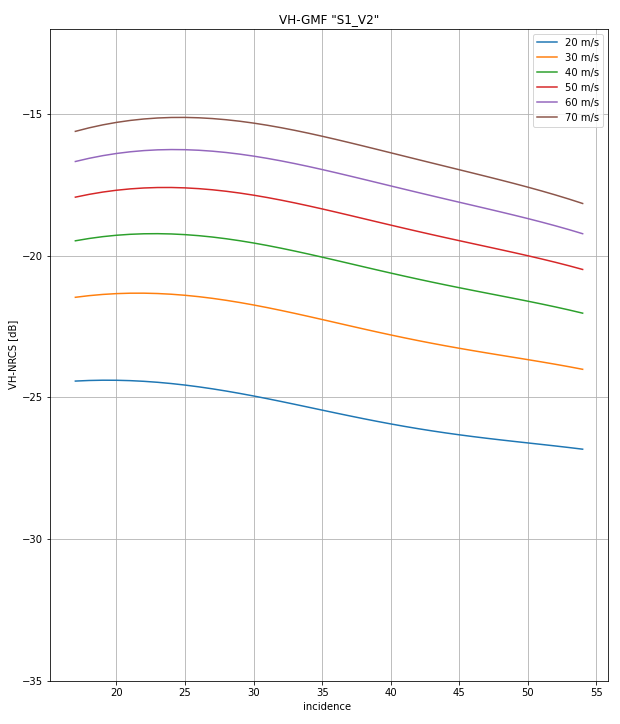
Figure 1. Sentinel-1 Cross-Pol GMF (July 2023). NRCS vs Wind Speed for incidence angles between 20° and 50° | Figure 2. Sentinel-1 Cross-Pol GMF (July 2023). NRCS vs Incidence Angle for wind speeds between 20 m/s and 70 m/s |
Radarsat-2 Cross-Polarization Geophysical Model Function (July 2023) (Courtesy of Alexis Mouche IFREMER) | |
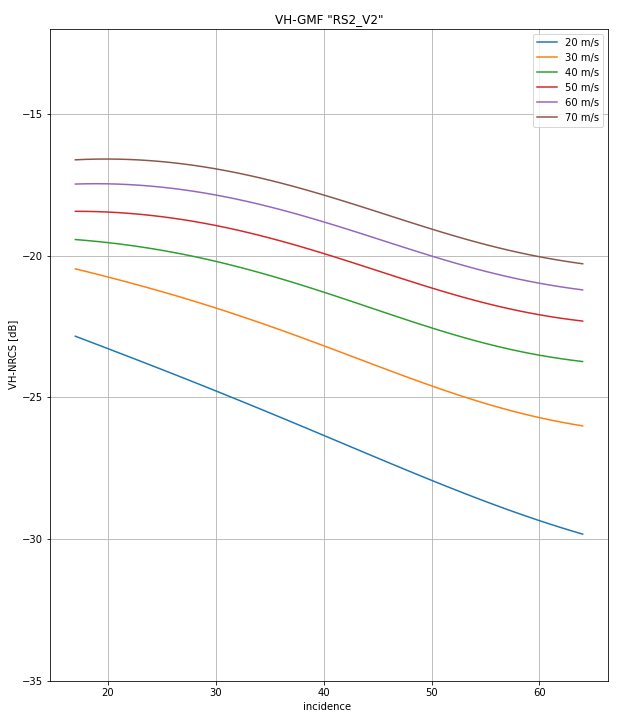
Figure 3. Radarsat-2 Cross-Pol GMF (July 2023). NRCS vs Wind Speed for incidence angles between 20° and 50° | Figure 4. Radarsat-2 Cross-Pol GMF (July 2023). NRCS vs Incidence Angle for wind speeds between 20 m/s and 70 m/s |

RCM Cross-Polarization Geophysical Model Function (July 2023) | |
Figure 5. RCM Cross-Pol GMF (July 2023). NRCS vs Wind Speed for incidence angles between 20° and 60° | Figure 6. RCM Cross-Pol GMF (July 2023). NRCS vs Incidence Angle for wind speeds between 20 m/s and 70 m/s |
Wind Speed Interpretation
Synthetic aperture radar (SAR), like other microwave sensors, works by transmitting a radar pulse and recording the backscatter energy from the reflected pulse. The SAR records both the amplitude and phase of the return signal and achieves the “synthetic aperture” by combining successive return pulses over a finite integration time. For a polar orbiting system (like Sentinel-1) a 400 km long SAR image is acquired in about 1 minute (with each line representing an integration time of approximately 0.5 sec). The SAR image is therefore essentially an instantaneous snapshot of the surface roughness (winds) at fine (< 100m) resolution.
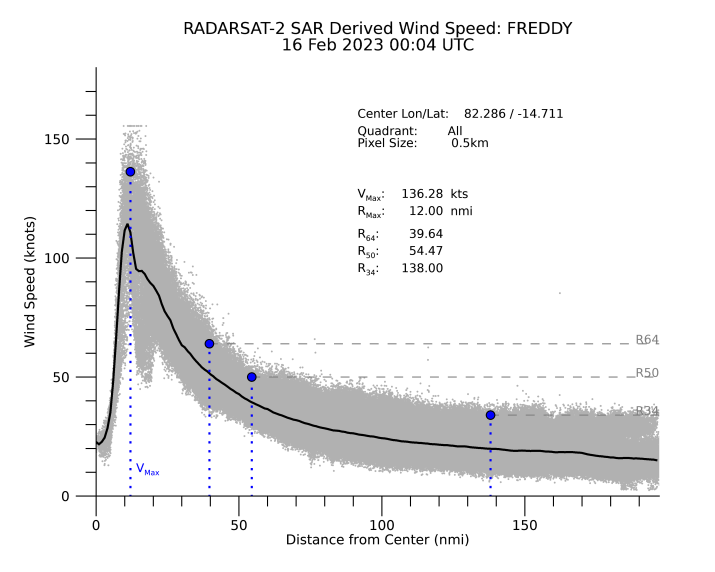
Meteorologists, however, characterize Tropical Cyclone winds using either a 1 min (or 10 min) average. So in order for the SAR wind speeds to be valuable, they need to be “transformed” into something similar. To produce a “one minute average” SAR wind speed, the SAR winds are spatially smoothed to 3 km. This value was obtained by multiplying a wind speed value of 50 m/s associated with moderate storm intensities by 1 minute (50 m/s x 60 sec = 3 km). It is this 3 km smoothing that is used when constructing the radial wind profiles from SAR that are used to determine the VMax, RMax and 34, 50 and 64 knot quadrant fixes.
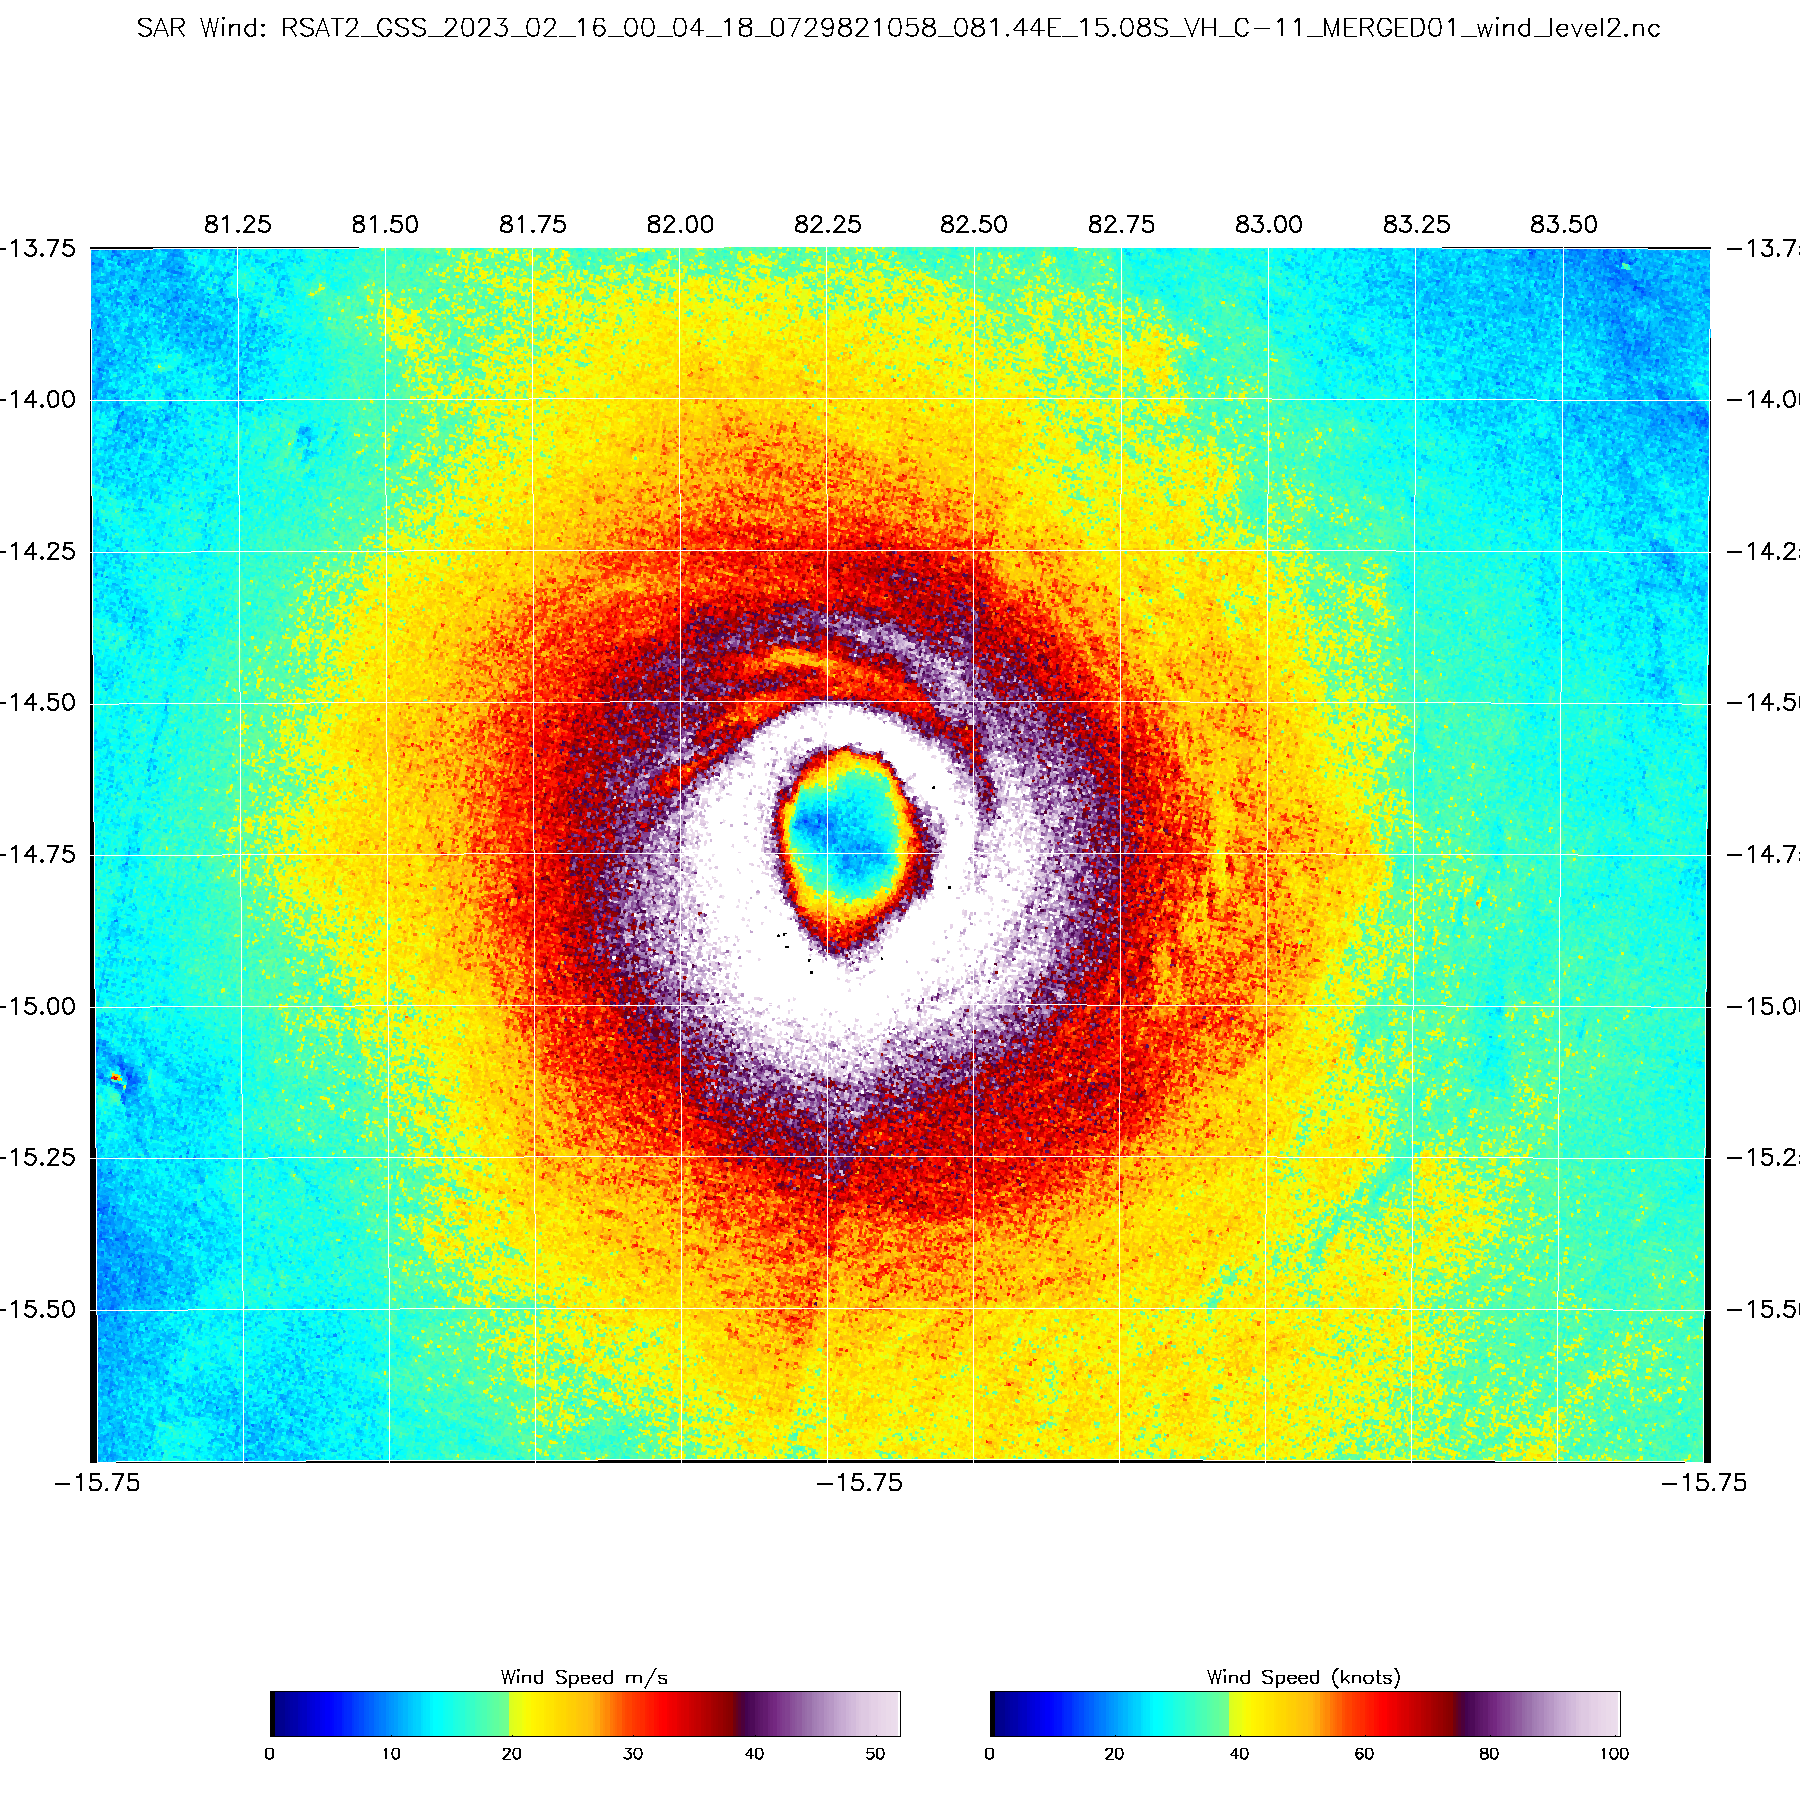
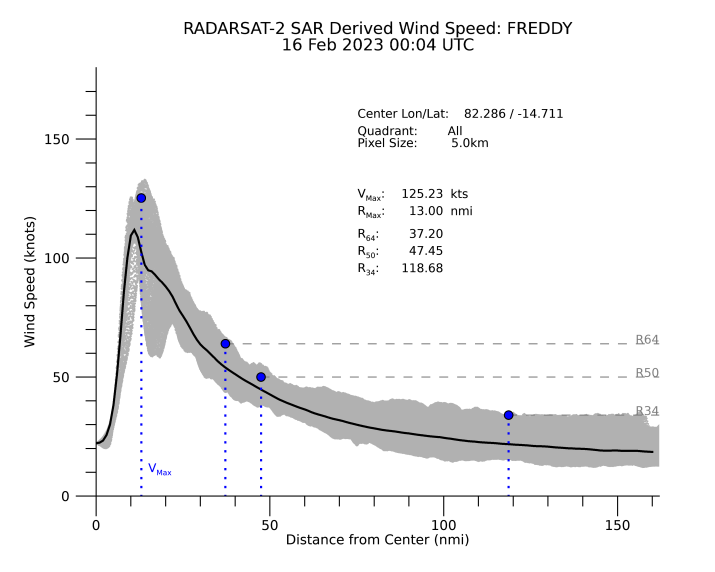
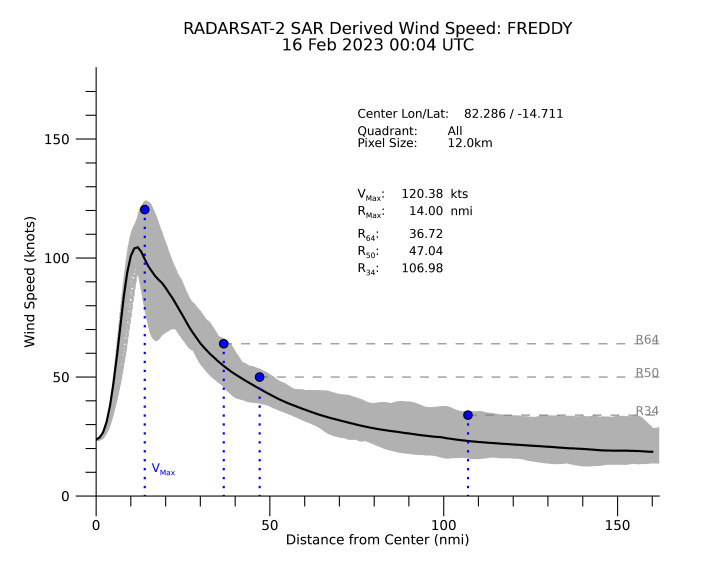
The effect of the spatial averaging on wind speed is shown in the table and figures below. The data are from Radarsat-2 acquired over Tropical Cyclone Freddy in the Southern Indian Ocean on 16 February 2023. (Best track VMax was 134 kts). Longer averaging results in lower wind speeds which will reduce the fix radii. Note, although the wind values are smoothed, the sampling of the wind imagery remained 0.5 km.
VMax (kts) | RMax (nmi) | R64 (nmi) | R50 (nmi) | R34 (nmi) | |
0.5 km | 136.3 | 12.0 | 39.6 | 54.5 | 138.0 |
3.0 km | 125.2 | 13.0 | 37.2 | 47.5 | 118.7 |
12.0 km | 120.4 | 14 | 36.7 | 47.0 | 107.0 |
Figure 1. Radarsat-2 0.5 km wind speed and full storm radial profile for TC Freddy 16 Feb 2023 at 00:04 UTC. The 0.5 km processing gives a VMax of 136.3 kts. |
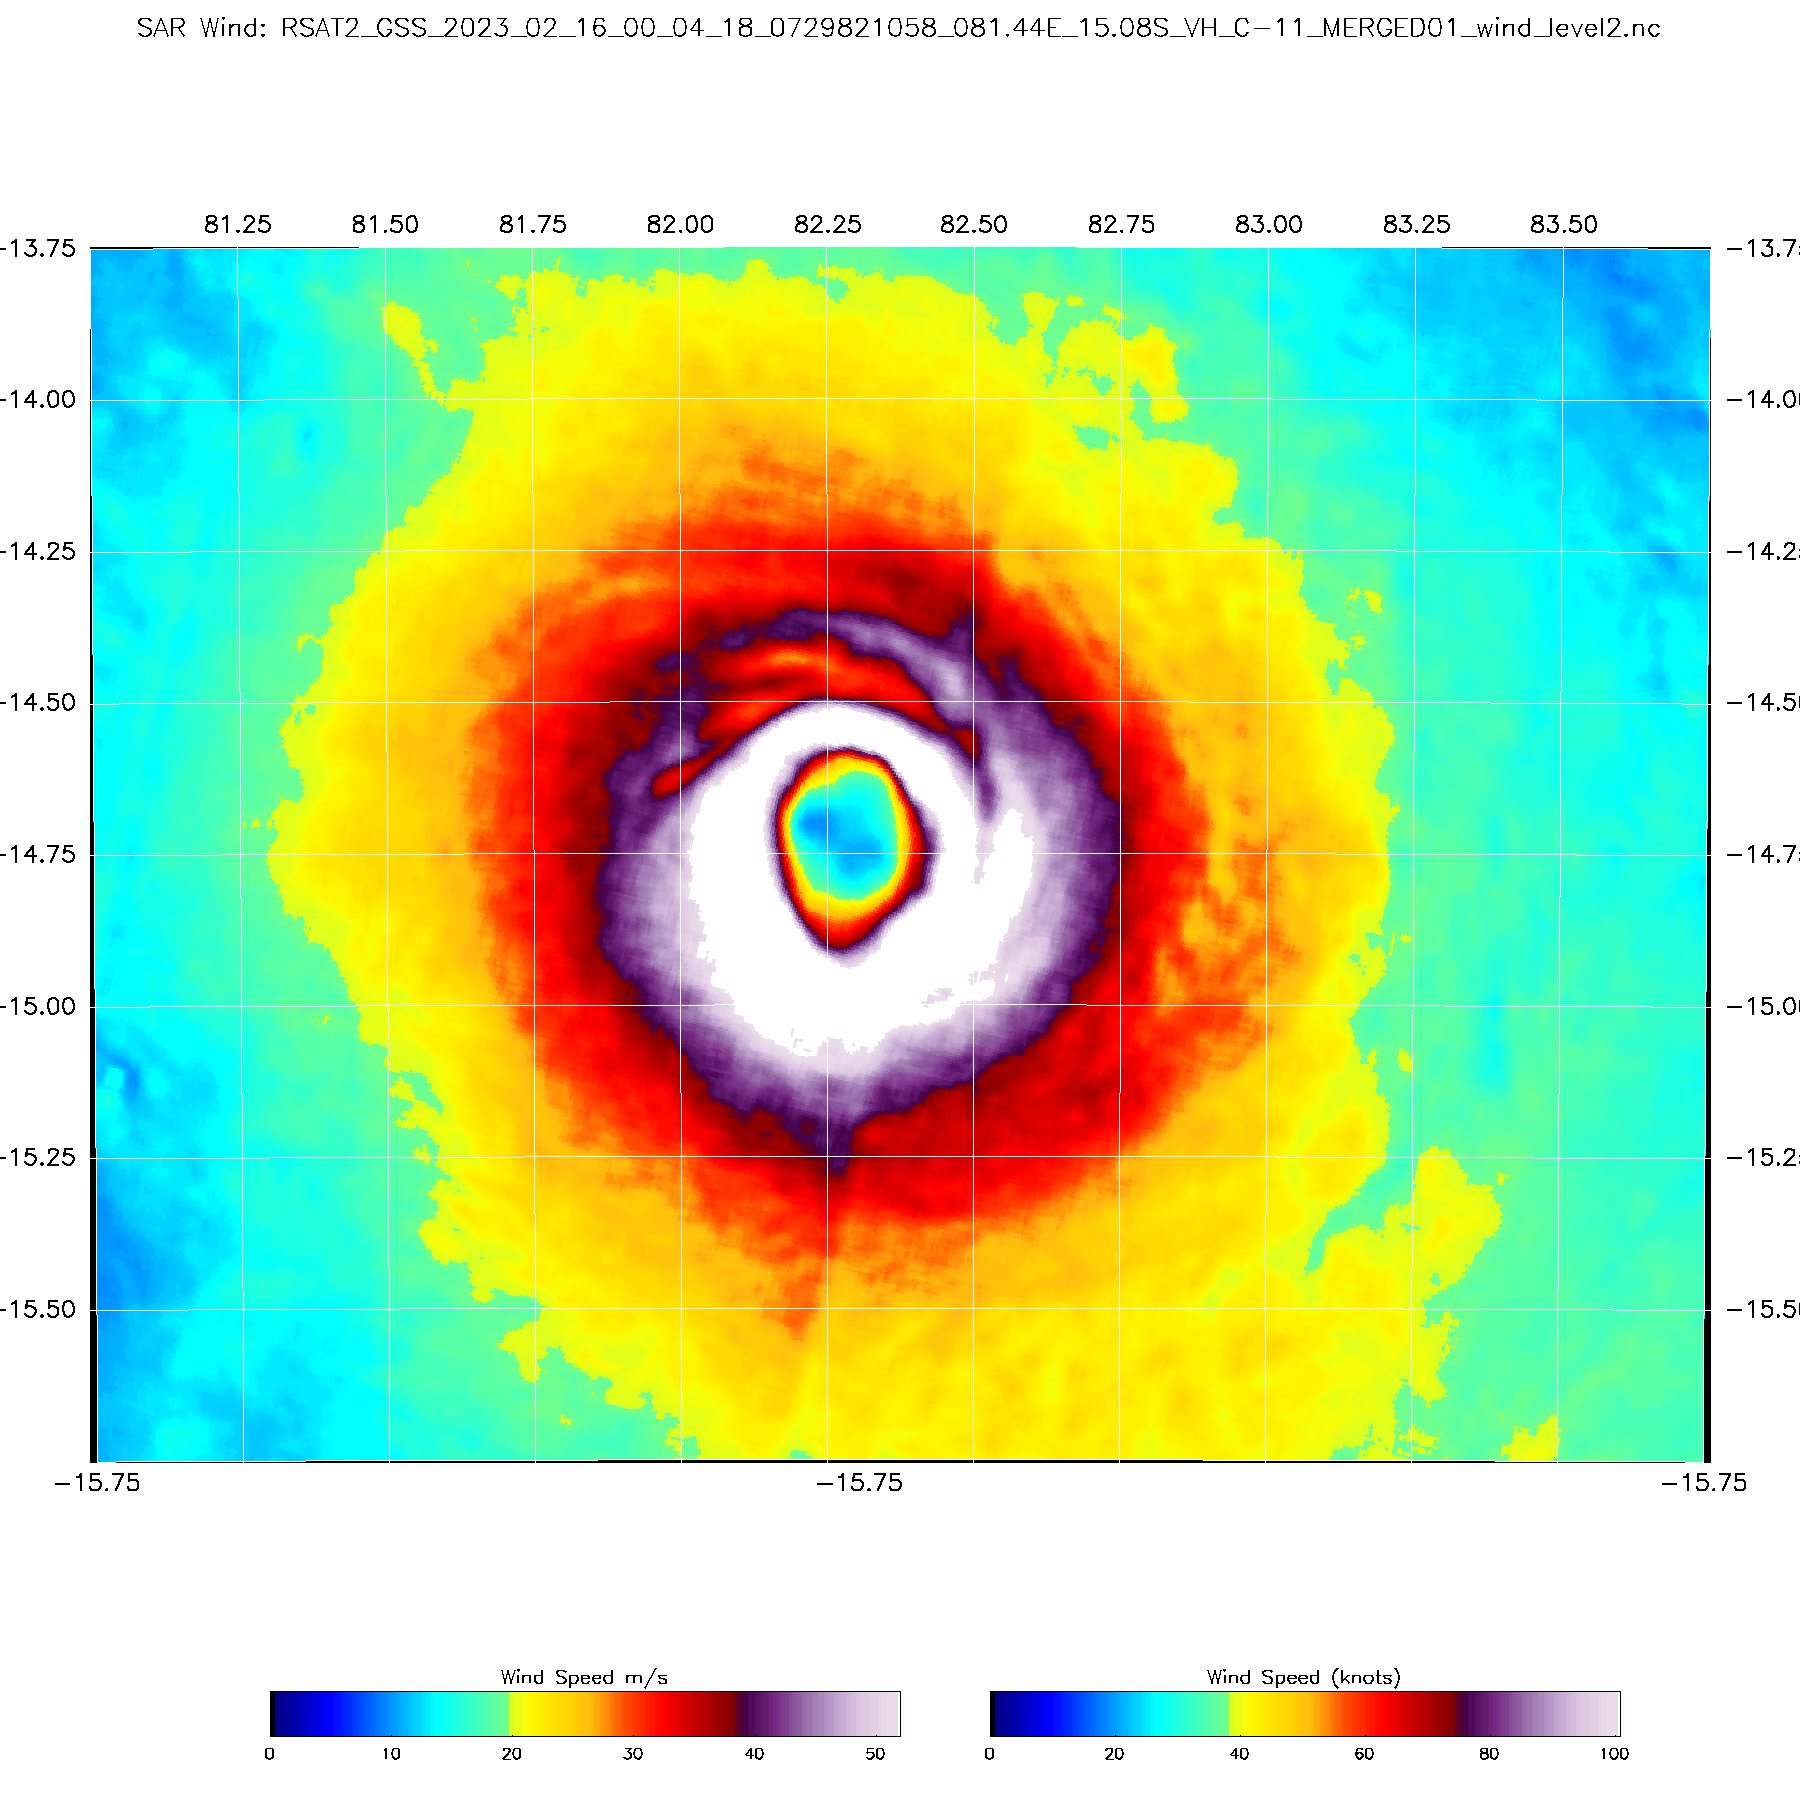
Figure 2. Radarsat-2 wind speed and full storm radial profile with 3 km smoothing for TC Freddy 16 Feb 2023 at 00:04 UTC. The 3 km (1-min equivalent) processing reduces the VMax to 125.2 kts. |
Figure 3. Radarsat-2 wind speed and full storm radial profile with 12 km smoothing for TC Freddy on 16 Feb 2023 at 00:04 UTC. The 12 km processing reduces the VMax to 120.4 kts. The 12 km smoothing result was meant to simulate the cell size for a scatterometer. |

Citation
If you are using products from this webpage, please be sure to credit NOAA’s Center for Satellite Applications and Research (STAR). Please include the following citation:
"Synthetic Aperture Radar (SAR) based tropical wind products were generated and provided through the STAR Water Surface Conditions Science Team’s tropical cyclone winds program. See the following webpage (https://www.star.nesdis.noaa.gov/socd/mecb/sar/sarwinds_tropical.php) for more information."