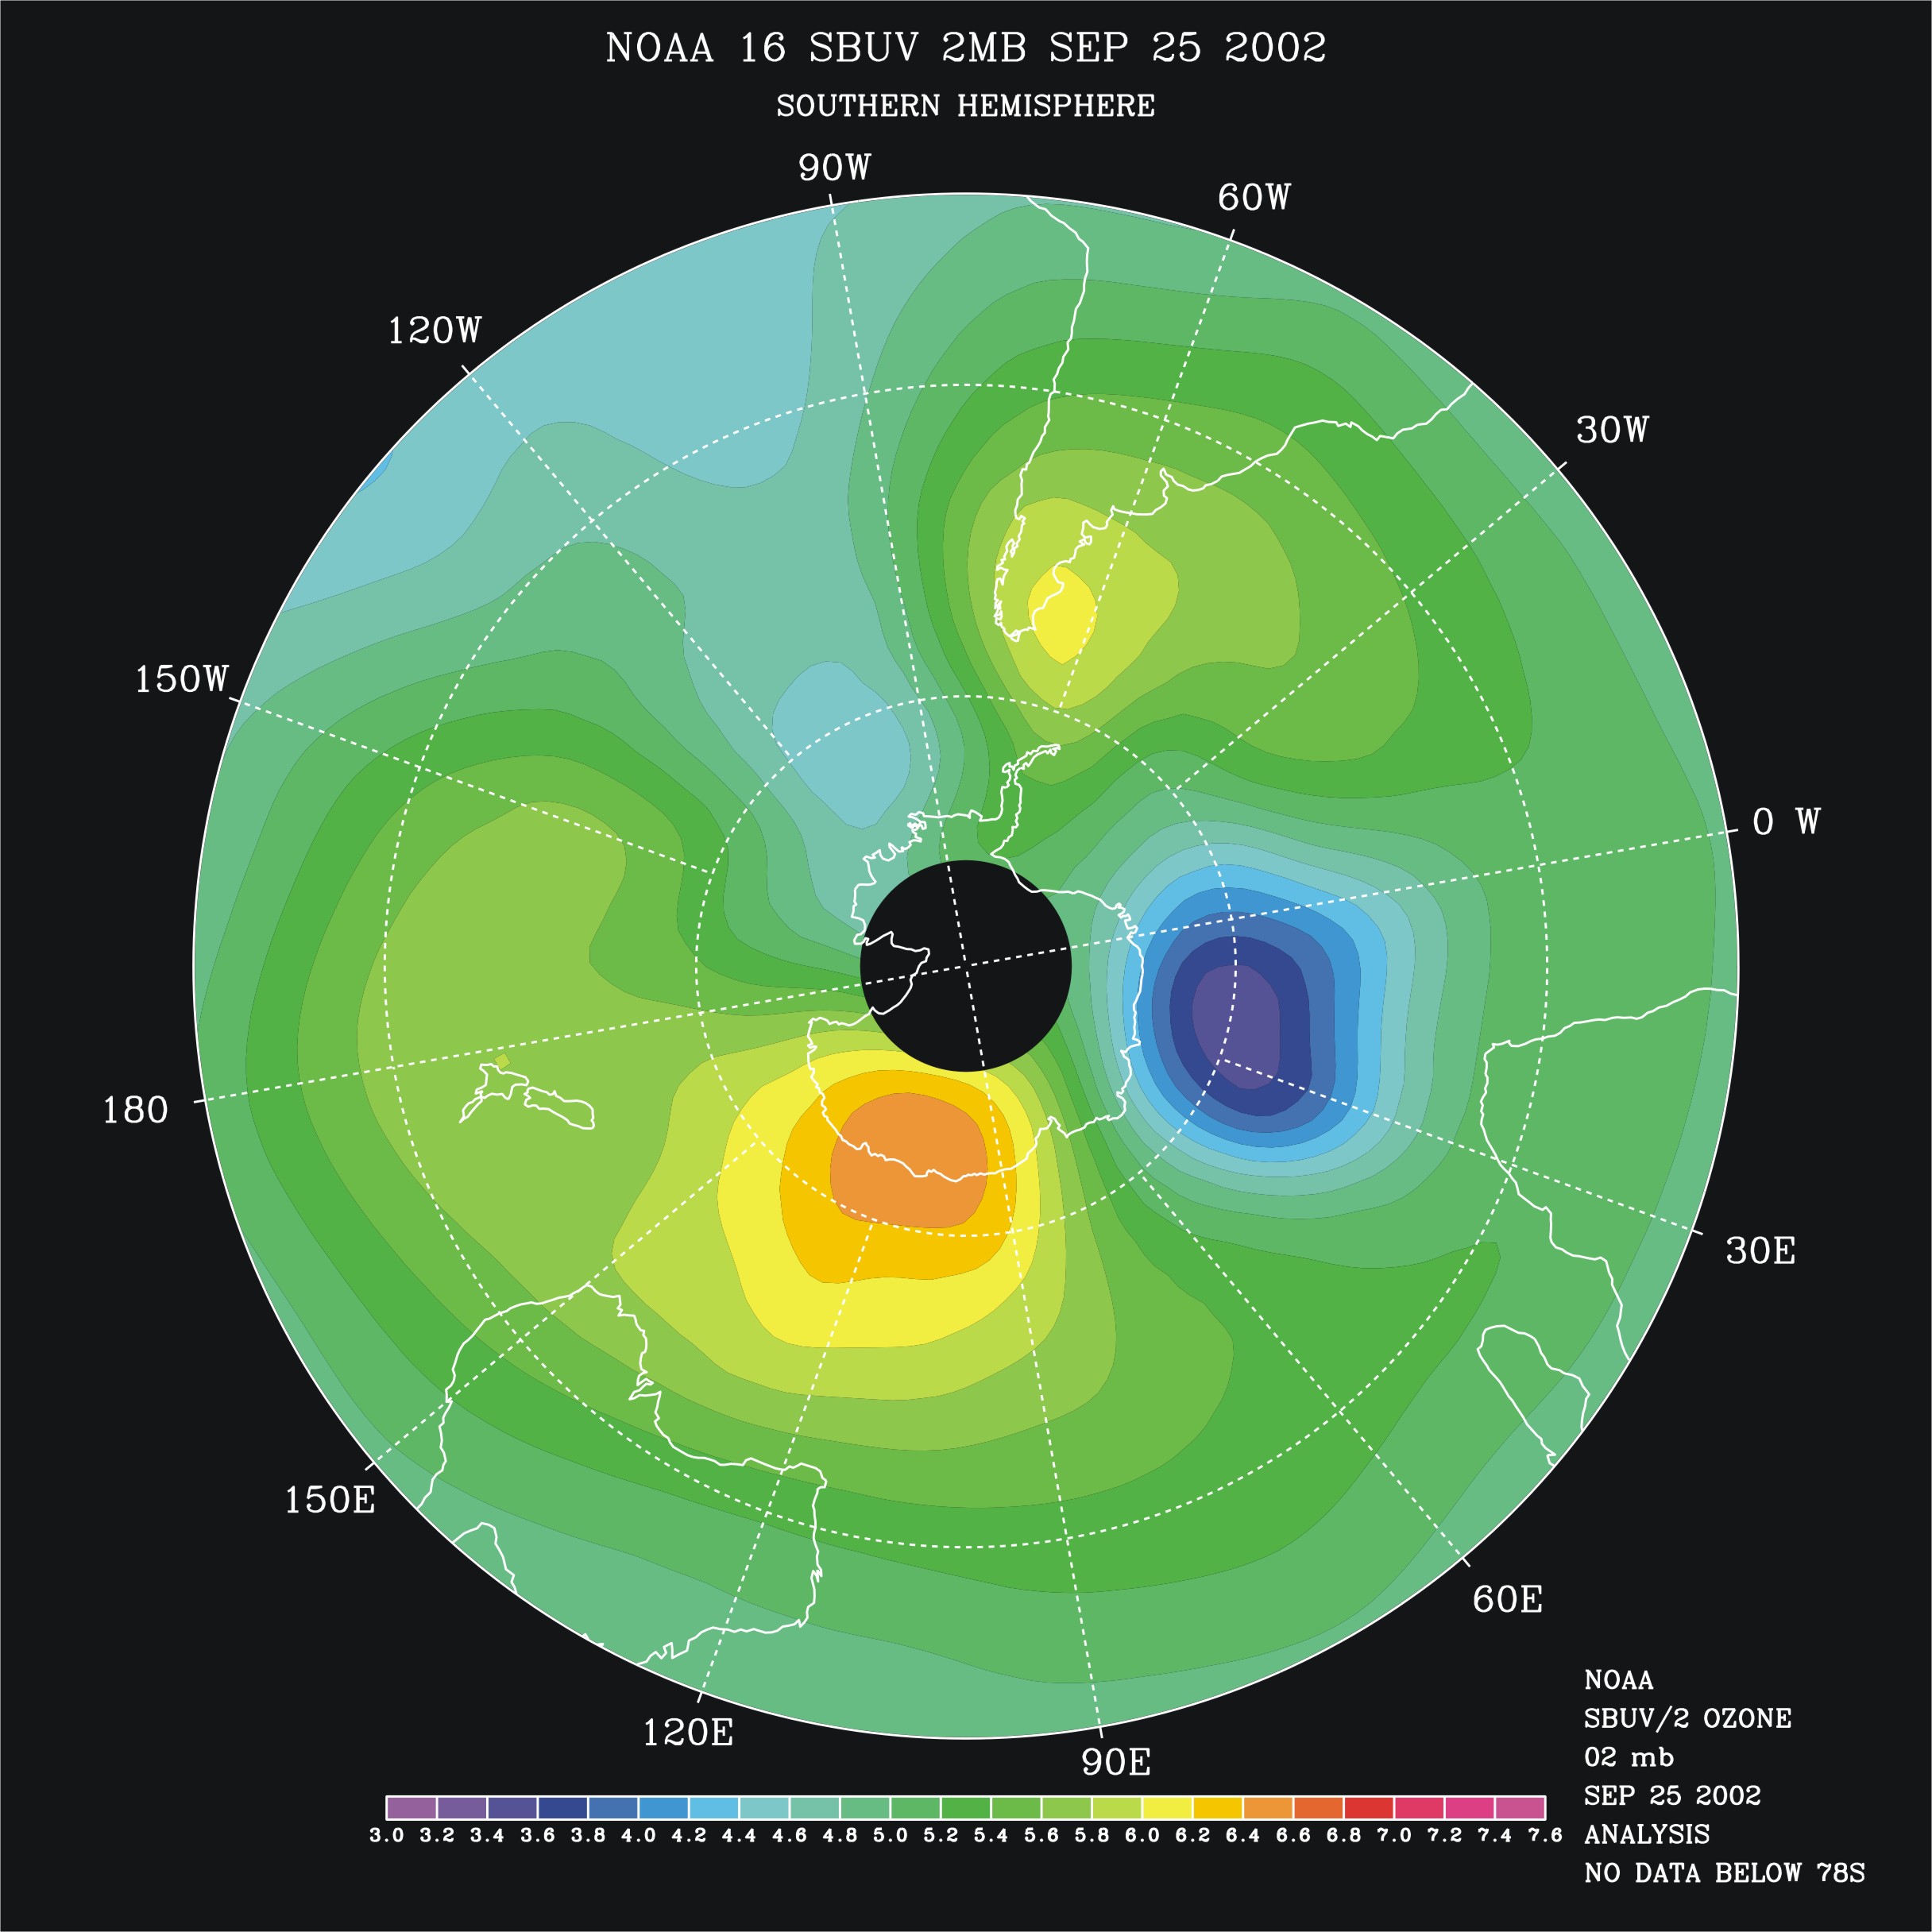
This is a false color contour map of the atmospheric ozone mass mixing ratios at 2 mbar for September 25, 2002 with a view of the Southern Hemisphere centered at the South Pole. This gives a horizontal slice of the atmosphere during the unusual splitting of the south polar vortex. It should be compared to Figure 092502_30mb.jpg. It is much less dramatic than the map for 30 mbars. It has a low ozone feature with concentrations down to mass mixing ratios of 3.4 (ppmv) south of Africa and a high ozone region south of Australia with concentrations as high as 6.4 (ppmv). The low ozone region corresponds to one lobe of the split polar vortex. The lobe over the southeastern Pacific appears as a slightly depressed region with values remaining above 4.4 (ppmv).