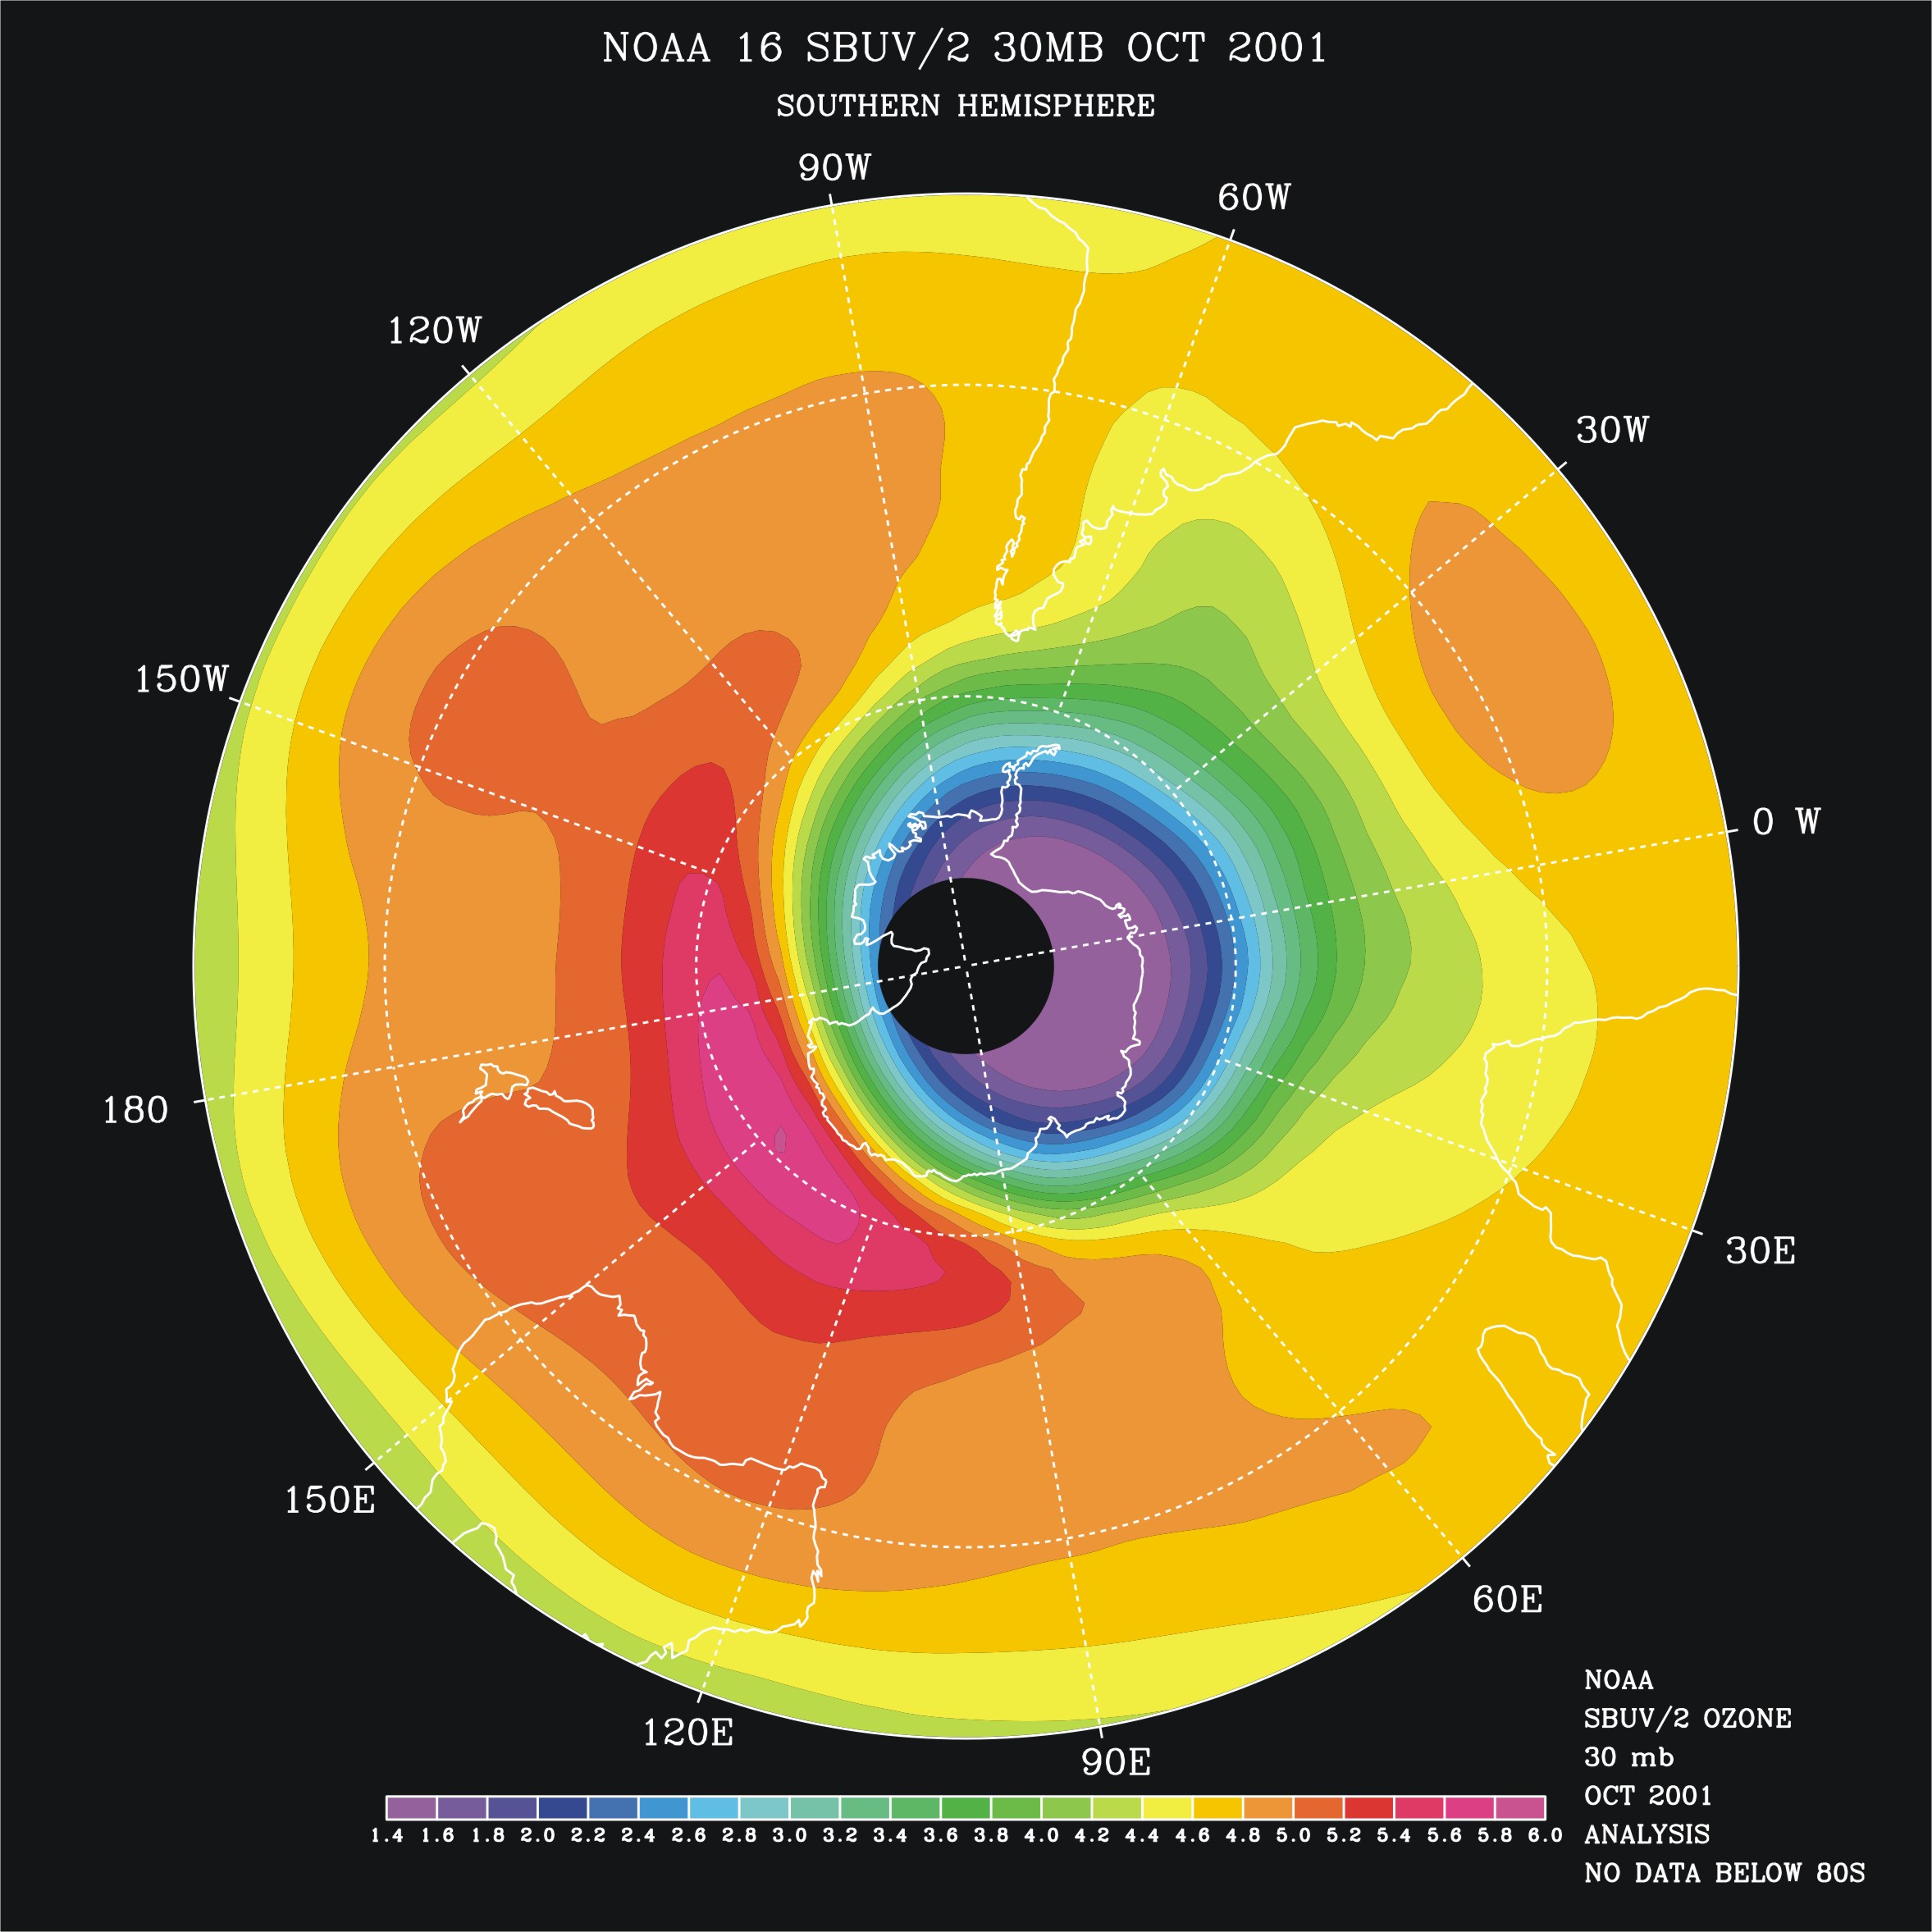
This is another false color contour map of the atmospheric ozone mixing ratio at 30 mbar. It should be contrasted to the map in Figure 1081_30mb.jpg. This map shows the mean ozone for the month of October 2001 (20 years later than 1081_30mb.jpg) over the southern hemisphere as measured by the NOAA-16 SBUV/2 instrument. The ozone amounts vary from a quasi-circular region with lower ozone concentration mass mixing ratios from 1.4 to 3.5 (ppmv) over the Antarctic continent to a collar region from 50 to 70 S from the Southern Indian Ocean eastward beyond New Zealand with higher concentrations up to 6.0 (ppmv). The values drop off toward lows of 4.0 (ppmv) as one moves toward the Equator, similar to the 1981 results.