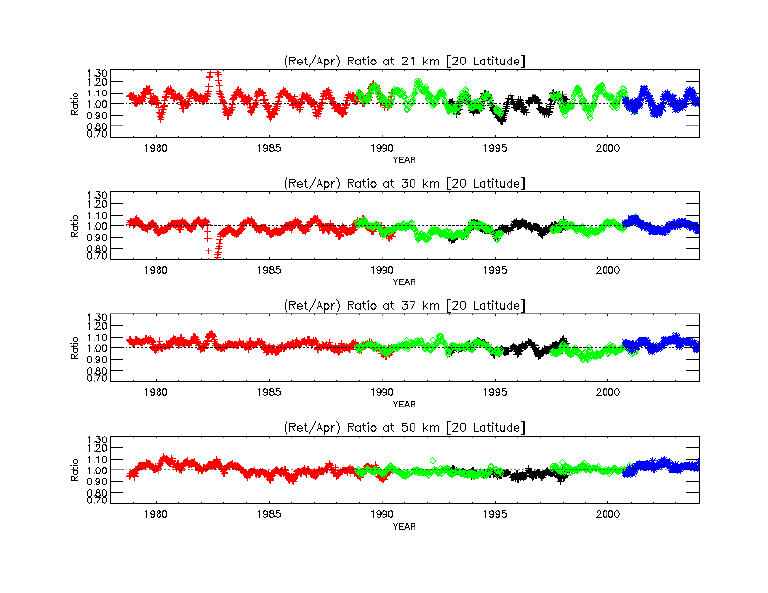
Time Series of the Ratios of Retrieved
to
A Priori for other Latitudes
Difference between
Instruments as
Functions of Altitude and Latitude
|
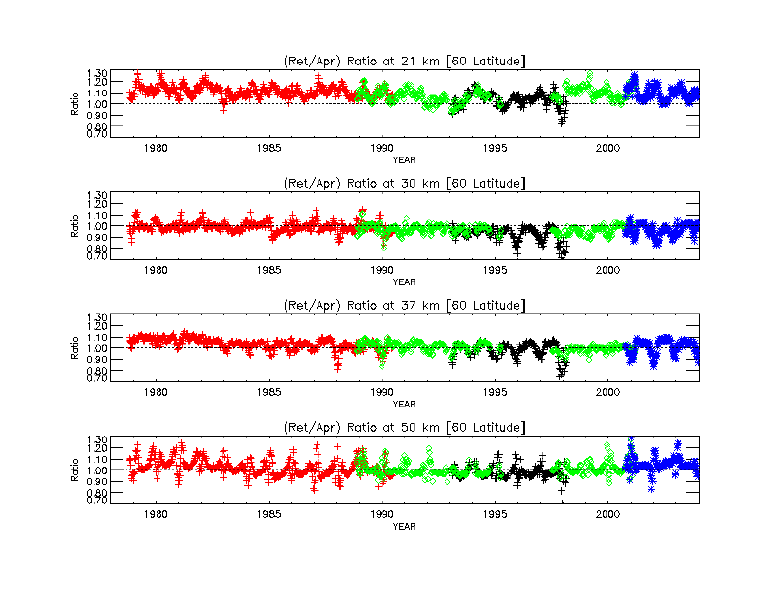
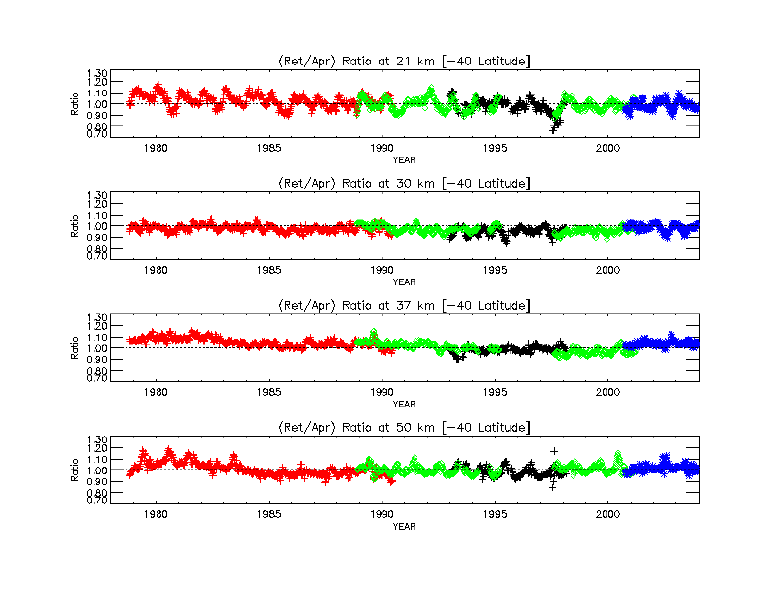
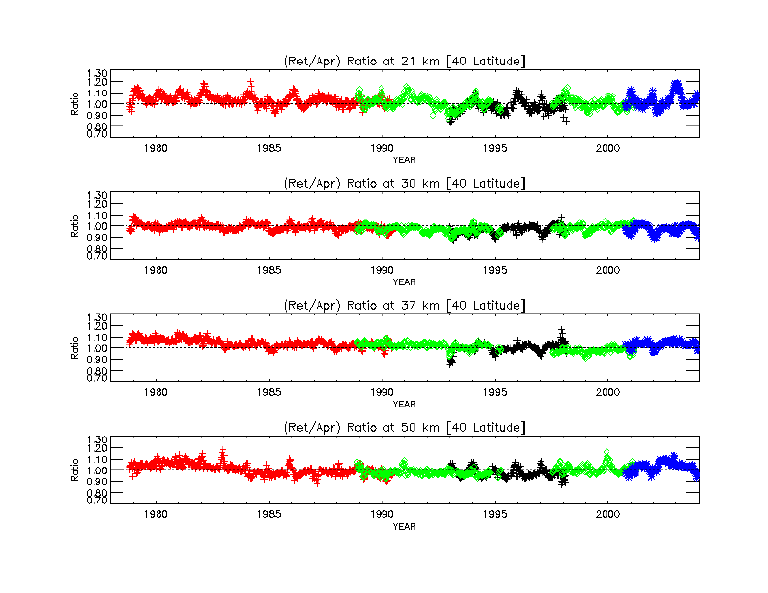
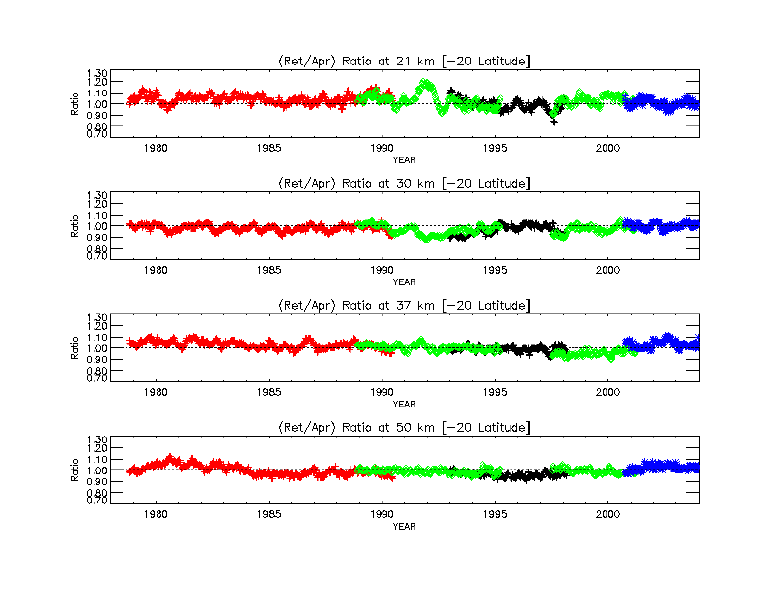
The relationships between two instruments for overlapped time periods are summarized in the contour plots. (Click on the figure below for the full size version.) The contour plots show the average differences between the zonal mean mixing ratios (ppmv) at pressures from 50 hPa to 0.5 hPa (21 km and 54 km) from two satellites during an overlap period. Percent difference greater than 10% in absolute value are included in the appropriate �(6 to 10)% classes. |
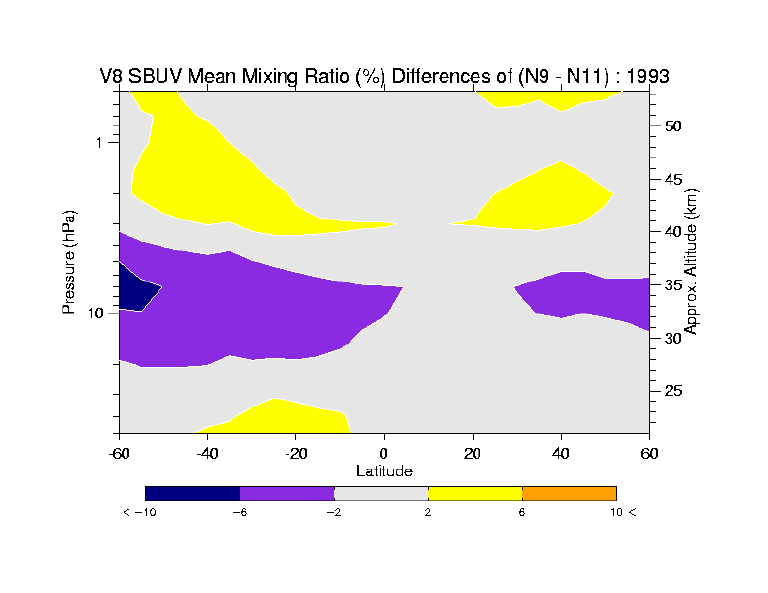 (N9 - N11) for 1993
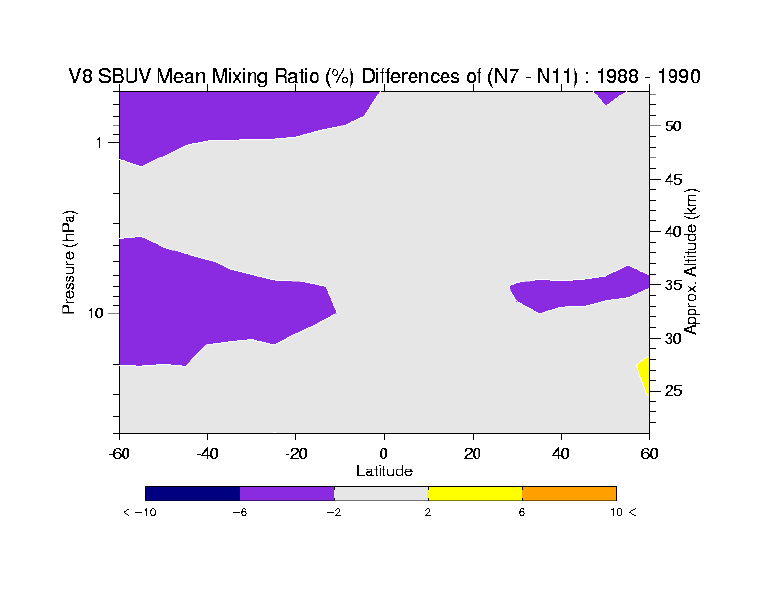 (N7 - N11) for 1988 to 1990
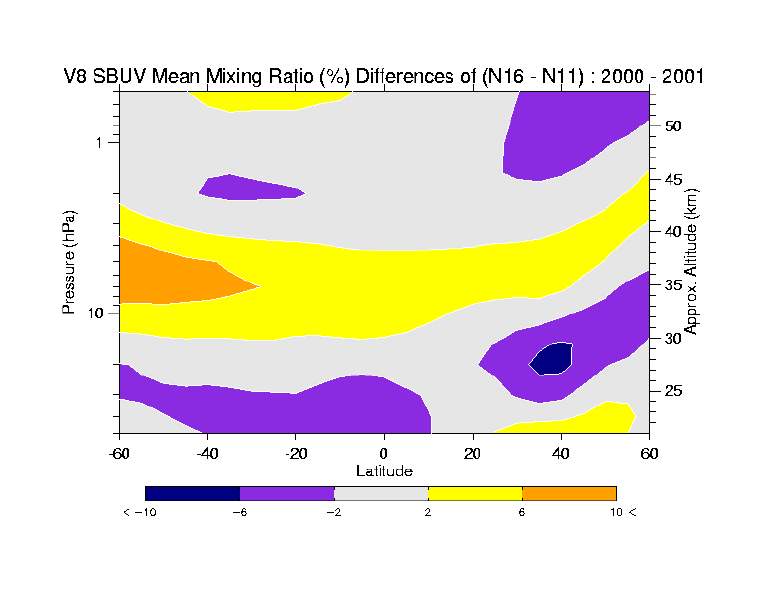 (N16 - N11) for 2000 to 2001
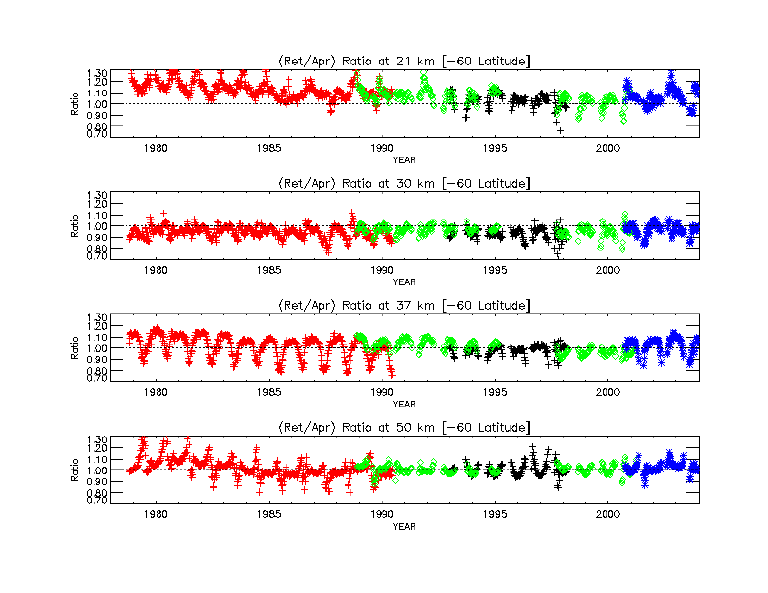
Go back to the V8 Validation Page